
QUESTION: Interpret the 12-lead ECG below.
- What is the rhythm?
- What is the most remarkable finding on this tracing?
- Clinically — What else may be going on?
 |
| Figure 1 — No history is available on the patient. |
INTERPRETATION: The rhythm is rapid and regular. It appears that the R-R interval is ~2 large boxes, so that the rate is ~150/minute. The QRS complex is narrow, and upright P waves are present in lead II with a fixed PR interval. The rhythm is therefore sinus tachycardia.
- We fully acknowledge that it is not easy to be certain of the rhythm from inspection of lead II alone (the small upright deflection preceding QRS complexes in lead II could be a P wave, T wave, or both). Lead V1 is often the next best lead to look at when assessing a patient's rhythm — and one clearly sees a P wave with negative deflection and consistent PR interval preceding the QRS in lead V1 (thus confirming the rhythm as sinus).
- List #3 (Figure 2) helps us recall the likely reasons for QT Prolongation ( = "Drugs — Lytes — CNS"). Clinical correlation is needed to determine which of these may be relevant for the patient in question.
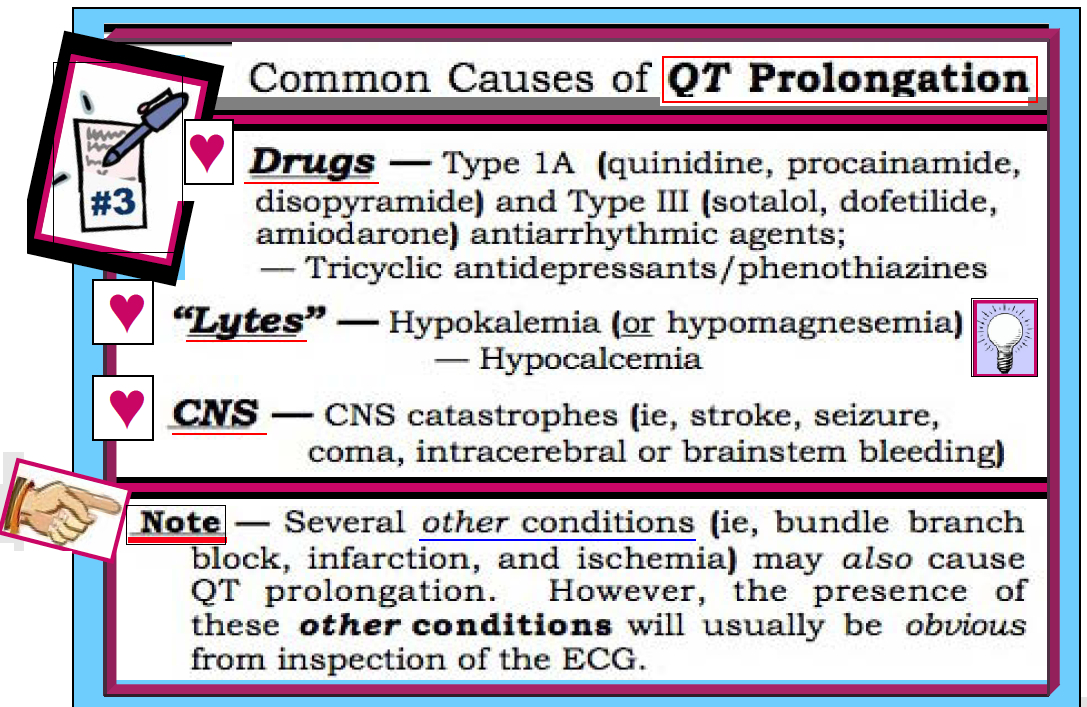 |
Figure 2 - Common Causes of QT Prolongation.
|
Returning to Our Systematic Approach: The axis in Figure 1 is normal (+15 degrees). There is no chamber enlargement. ST-T wave changes are dominated by the prolonged QT interval.
CLINICAL IMPRESSION: We interpret this ECG as showing sinus tachycardia at ~150/minute. There are diffuse non-specific ST-T wave abnormalities — and a markedly prolonged QT interval. Clinically — QT prolongation in the absence of infarction, ischemia or a conduction defect should make one think, "Drugs — Lytes — CNS" (the causes in List #3).
--------------------------------------------------
NOTE: See Section 06.0 from our ECG-2014-ePub for more information on Long QT and Torsades de Pointes.
--------------------------------------------------
NOTE: See Section 06.0 from our ECG-2014-ePub for more information on Long QT and Torsades de Pointes.
--------------------------------------------------
Sorry, but I don't see any P waves....
ReplyDeleteWhy not TA/Flutter? vagal maneuvers?
Thanks
@ Nowhere man - There ARE P waves present and visible in several leads on this tracing- Note the BLUE arrows I have drawn in several leads showing this - GO TO - https://www.dropbox.com/s/30rq9qewc78ci3l/ECG%20Blog-4%20-%20P%20waves-BLUE%20arrows.png?dl=0 - As a result, there was no need to do a vagal maneuver. The rhythm is sinus - not atrial flutter. Hope that answers your question - :)
ReplyDeleteSimple but great case.. Ecg image not very clear though;easy to miss on those P waves
ReplyDeleteThis is a hard tracing — but I DO think the P waves are clear enough. You have to look in MULTIPLE leads. For example, we see a DEFINITE “something” with similar PR interval in front of the QRS in leads I, II, III, aVR, aVL, aVF and V1. The shape in V1 is exactly the shape of what sinus P waves often look like, and this does NOT look to be part of the ST-T wave in lead V1 — therefore very supportive that this is sinus tachycardia.
DeleteCould you show where p waves sir
ReplyDeleteCoz if I saw this ecg I will say its atrial flutter not sinus rhythm...thank you for your effort sir
I agree that it is difficult to be certain about atrial activity in this tracing — because the P wave “blends in” with the end of the prolonged QT interval. That said — the fact that a definite peak occurs at the SAME point in multiple leads (positive in leads II, III, aVF — and negative in leads aVR and V1) tells us that this “peak” is from a sinus P wave (the peak is upright in lead II). To confirm further would require a repeat ECG after the rate slowed enough to allow better definition of the P wave (and some separation from the preceding T wave).
DeleteThanh you very much for your case and explantation, I'm just a medical student from Viet Nam. ST-T wave changes are dominated by the prolonged QT interval AND infarction or ischemia may also cause QT prolongation. Can I ask you how do we know if the patient have ischemia or infarction? Is that clinical presentation?
ReplyDelete@ Khanh — THANK YOU for your question! As is often the case — a LOT depends on the clinical situation. Much of the time the history (ie, new-onset severe chest pain in a high patient) — and OTHER findings on the ECG (ie, not only QT prolongation, but a worrisome SHAPE of ST elevation, with mirror-image opposite reciprocal changes) will tell you if you are dealing with acute ischemia/infarction as the cause of the long QT. That said — with entities such as Takotsubo Cardiomyopathy — it is common to see BOTH marked QT prolongation AND acute-looking ST-T wave changes — so it all comes down to the history and the actual ECG — and then sometimes you need to do a cath (P.S. And by then you have of course ruled out electrolyte abnormalities with your lab results — :)
ReplyDelete