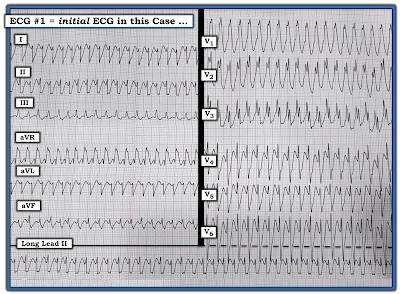
- How would YOU interpret this ECG?
- Why are there 3 different QRS shapes?
- Has there been a recent infarction?
- Does the Ashman Phenomenon apply?
 |
| Figure-1: 12-lead ECG and long lead II rhythm strip that was sent to me without the benefit of any history. Why are there 3 different QRS shapes? Does the Ashman Phenomenon apply? (NOTE: Although this smart phone photo of the tracing is significantly angled — I believe it is still adequate for accurate interpretation). |
My Sequential Thoughts for Interpreting this Tracing:
As always — I began my systematic approach with assessment of the rhythm. This is especially important to do for today's tracing — because it is all but impossible to interpret the 12-lead ECG in Figure-1 without full awareness of what is going on with the rhythm!
- PEARL #1: It is often insightful to spend a few seconds (No more than 5 seconds should be needed!) — by stepping back, and taking a look at the overall pattern of the rhythm (if there is one). In Figure-1 — I was struck by the repetitive pattern of 3-beat groups that preserved the identical sequence of changing morphologies with a very similar sequence of R-R intervals throughout the tracing. This could not be by chance!
I next began my systematic approach to the rhythm in my usual manner, with assessment of the Ps, Qs and 3Rs (as discussed in detail in ECG Blog #185).
- NOTE: It does not matter in what sequence you assess the 5 parameters in the Ps, Qs, 3R Approach — as long as you always look for each of these 5 parameters with every rhythm you encounter (ie, Look for P waves — QRS width — Rate and Regularity of the rhythm — and whether P waves are Related to neighboring QRS complexes). I'll often vary the sequence I choose — depending on particulars of the rhythm at hand.
- In Figure-1 — we've already looked at Regularity of the rhythm, for which we noted in PEARL #1 the repetitive pattern of 3-beat groups.
- PEARL #2: I've often been amazed at how helpful the simple step to label P waves can be for clarifying the mechanism of the rhythm. Complex relationships between P waves and neighboring QRS complexes often become obvious once this simple step is done. Along the way — I like to number the beats, which greatly facilitates your communication when discussing the rhythm with colleagues (Figure-2).
 |
| Figure-2: I've labeled the P waves that can clearly be seen (See text). |
- Do YOU see any indication in Figure-2 that there might be more P waves than the ones that I labeled?
- KEY Point: Where is the best place to look for additional P waves?
- IF an underlying sinus rhythm is present — the best place to look for additional P waves in Figure-2, will be approximately midway between each of the longer spaces on the rhythm strip in which there are no RED arrow P waves.
- Using calipers facilitates process!
- What do you see in Figure-3?
 |
| Figure-3: I've added PINK arrows to highlight a "telltale notch" that occurs just after the QRS complex of beats #2, 5, 8 and 11 in the long lead II rhythm strip. Similar notching is seen just after beats #2 and 5 in leads III, aVR and aVF (See text). |
- The underlying mechanism of the rhythm is sinus. PINK arrows reveal that P waves were "hiding" just after the QRS complex of beats #2, 5, 8 and 11.
- The P-P interval does vary a little throughout this rhythm strip. This is consistent with sinus arrhythmia.
- The PR interval is constant and normal (ie, ≤0.20 second) before beats #3, 6, 9 and 12. The QRS complex of each of these beats is narrow. Therefore — the 1st beat in each of the 3-beat groups (ie, beats #3, 6, 9 and 12) is sinus-conducted.
- Although the QRS complex of the 2nd beat in each group is wide — the PR interval preceding these beats (ie, beats #4, 7 and 10) is the same as the PR interval preceding beats #3, 6, 9 and 12. Therefore — beats #4, 7 and 10 (and also beat #1 at the beginning of the tracing) — are all sinus-conducted, but with bundle branch block!
- Beats #2, 5, 8 and 11 are wide and very different in shape from the other wide beats in this tracing. These beats occur early, and are not preceded by a premature P wave. Therefore — beats #2, 5, 8 and 11 are PVCs (Premature Ventricular Contractions).
- PEARL #3: Some PVCs conduct retrograde to the atria. Some do not. The fact that sinus P waves continue throughout the long lead II rhythm strip in Figure-3 without being inhibited by wide beats #2, 5, 8 and 11 proves that these wide beats are PVCs. This is because IF these beats were either aberrantly conducted PACs or PJCs — they would have "reset" the SA Node, which would have suppressed the PINK arrow sinus P waves.
- P waves — The PINK and RED arrows show fairly regular sinus P waves, consistent with sinus arrhythmia.
- QRS width — Sinus-conducted beats #3, 6, 9 and 12 are narrow. Sinus-conducted beats #1, 4, 7 and 10 are wide and conduct with bundle branch block.
- Regularity — There is a repetitive pattern to the rhythm, with similar looking 3-beat groups.
- Rate — The P-P interval between any 2 consecutive RED arrows is between 3-to-4 large boxes, corresponding to an underlying atrial rate of ~85/minute.
- Related — The PR interval preceding the first 2 beats in each group is constant, such that these P waves are related to neighboring QRS complexes (ie, these beats are sinus-conducted).
- PEARL #4: I believe the reason beats #1, 4, 7 and 10 all conduct with BBB aberration — is that this represents an unusual manifestation of the Ashman Phenomenon. Simply stated — the Ashman Phenomenon results from the fact that the RP (Refractory Period) is in large part determined by the duration of the preceding R-R interval. The longer the preceding R-R interval — the longer the subsequent RP — and the greater the chance that an earlier beat will encounter a part of the conduction system that is still in a refractory state (ie, "The funniest-looking beat follows the longest pause"). In Figure-3 — beats #4, 7 and 10 all follow the longest pauses in this tracing, which therefore accounts for the BBB aberration.
- Beyond-the-Core: QRS morphology for aberrantly-conducted beats #1, 4, 7 and 10 resembles LBBB (Left Bundle Branch Block) conduction — because there is a wide, monophasic R wave for the QRS of beat #1 in lead I — and there is predominant negativity for the QRS of beat #9 in leads V1, V2, V3. That said — the all-negative QRS for beat #4 in lead aVL is distinctly atypical for LBBB conduction.
- NOTE: Full review of aberrant conduction and the Ashman Phenomenon can be found at the bottom of the page in today's Addendum (which includes an Audio Pearl and Video Pearl on these topics).
 |
| Figure-4: The 12-lead ECG and long lead II rhythm strip in today's case. Has there been a recent infarction? (See text). |
- PEARL #5: In order to assess today's 12-lead ECG for signs of ischemia or infarction — we need to look in all 12 leads at those beats that are normally conducted with a narrow QRS complex. To do this — we need to focus on the appearance of beats #3, 6, 9 and 12 in other simultaneously-recorded leads (ie, We need to focus on those beats within the WHITE dotted-line rectangles in Figure-4).
- Unfortunately — beat #3 in the long lead II rhythm strip occurs at the same time that the standardization mark was recorded in leads I, II and III. As a result — we simply do not see what the QRST complex looks like in leads I and III.
- That said — the beat of most concern is beat #6. In lead aVL — beat #6 manifests a wide and deeply notched Q wave, ST segment coving with ever-so-slight ST elevation, and T wave inversion. In lead aVF — we see almost the mirror-image opposite picture, in the form of reciprocal ST depression with a terminal biphasic T wave. In association with the frequent PVCs (ie, ventricular trigeminy = every-third-beat is a PVC) — this raises concern for recent (if not acute) inferior MI.
- We get "4 looks" at the ST-T wave appearance in lead II (ie, beats #3, 6, 9 and 12 in the long lead II rhythm strip). Each of these beats supports our impression that there is reciprocal ST depression in the inferior leads.
- Assessment of QRST morphology in the anterior leads (leads V1, V2, V3) — shows small-but-present initial r waves in leads V2 and V3, and fairly unremarkable ST-T waves.
- QRST morphology in lateral chest leads V4, V5, V6 — is most suggestive of LV "strain", albeit R wave amplitude falls a bit shy of satisfying voltage criteria for LVH.
- CLICK on Figure-5 — which will magnify this Figure for you. Then advance one-by-one the next 5 Figures in the magnified mode to see our stepwise aproach for drawing this laddergram.
- For review on how to Read (and Draw) Laddergrams — See ECG Blog #188.
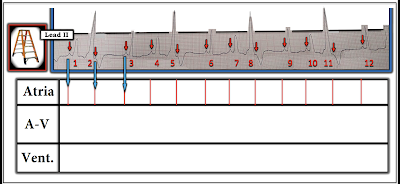 |
| Figure-5: Laddergram STEP-1. As always — I find it easiest to first complete the Atrial Tier, that shows atrial activity. The long BLUE arrows show how I line up from the beginning of each P wave (small RED arrows in the rhythm strip) — with the vertical line representation in the Atrial Tier. Slight irregularity of these vertical RED lines within the Atrial Tier is consistent with sinus arrhythmia. (NOTE: I use Power Point for all of my laddergram constructions — as this application makes it easy to duplicate precise measures — and drop precisely vertical lines to optimize accuracy). |
 |
| Figure-6: Because I was not initially certain of which of the different-looking QRS complexes were being conducted — I decided to next add in sinus-conduction of beats #3, 6, 9 and 12 which I was certain of (BLUE lines passing through the AV Nodal and Ventricular Tiers). |
 |
| Figure-7: The fact that the PR interval preceding the 2nd beat in each group (ie, beats #4, 7 and 10) is identical to the PR interval preceding the 1st beat in each group (ie, beats #3, 6, 9 and 12) — tells us that the 2nd beat in each group is normally conducted through the AV Node (BLUE lines passing through the AV Nodal and Ventricular Tiers). The reason the 2nd beat in each group is wide — is that because of the Ashman Phenomenon, these beats are conducted with BBB (Bundle Branch Block), as shown by the PINK butt-end attachments in the Ventricular Tier. |
 |
| Figure-8: Beats #2, 5, 8 and 11 are PVCs (Premature Ventricular Contractions) — because they are wide, very different in morphology from other beats on this tracing — and because they are not preceded by any premature P wave. Some PVCs conduct retrograde (ie, back into the AV Node — or even all the way back to the atria). BLUE arrows in this Figure show that we postulate retrograde conduction from these PVCs into the AV Nodal Tier. |
 |
| Figure-9: The P waves that occur just after beats #2, 5, 8 and 11 — penetrate the AV Node, but do not make it to the ventricles — because the PVCs prevent further conduction of these sinus impulses (BLUE lines with butt-ends within the AV Nodal Tier). The fact that the SA Node continues to put out sinus impulses throughout the long lead II rhythm strip (vertical RED lines throughout the Atrial Tier) — proves that beats #2, 5, 8 and 11 must be PVCs — because IF these beats were either aberrantly conducted PACs or PJCs, they would have temporarily suppressed the SA Node. |
 |
| Figure-10: Finished Laddergram. The mechanism I propose for the rhythm in today's case should be clear even to those providers who are not proficient in drawing laddergrams. Thus — there is sinus arrhythmia with 3-beat groups. Every 3rd beat is a PVC (ie, ventricular trigeminy). The first 2 beats in each group are sinus-conducted with the same (normal) PR interval — but the 2nd beat in each group conducts with BBB. |
==============================
Acknowledgment: My appreciation to Hafiz Abdul Mannan Shahid (from Lahore, Pakistan) for the case and this tracing.
==================================
==============================
Relevant ECG Blogs to Today's Case:
- ECG Blog #185 — Use of a Systematic Approach to Rhythm Interpretation.
- ECG Blog #188 — How to Read (and Draw) Laddergrams.
- ECG Blog #70 — Reviews the Ashman Phenomenon (as a condition that predisposes to aberrant conduction).
- ECG Blog #71 — Reviews why the Ashman Phenomenon may be less reliable in AFib (ie, because of "concealed conduction").
- ECG Blog #211 — Reviews in detail WHY Aberrant Conduction occurs (and why RBBB aberration is the most common form).
- ECG Blog #140 — Example of alternating Bifascicular Block Aberration.
- ECG Blog #14 — Example of Blocked PACs.
- ECG Blog #15 — Example of a WCT due to Aberrant Conduction.
- ECG Blog #33 — Example of PACs with varying degrees of Aberrant Conduction.
============================
ADDENDUM (1/28/2022):
I've added below from previous Blog posts a series of educational material regarding the Ashman Phenomenon — and the basics of Aberrant Conduction.

Today’s ECG Media PEARL #29 (8:00 minutes Audio) — Reviews WHAT the Ashman Phenomenon is — HOW to use it clinically? — and — whether the Ashman phenomenon is accurate when the underlying rhythm is AFib?
- NOTE: For detailed review of the Ashman Phenomenon — with illustration of its clinical application — Please See ECG Blog #70. Use of the Ashman phenomenon with AFib is reviewed in ECG Blog #71.
=======================================
Today’s ECG Media PEARL #28 (4:45 minutes Video) — Reviews WHY some early beats and some SVT rhythms are conducted with Aberration (and why the most common form of aberrant conduction manifests RBBB morphology).
- NOTE #3: I have excerpted a 6-page written summary regarding Aberrant Conduction from my ACLS-2013-ePub. This appears below in Figures-11, -12, and -13).
- CLICK HERE — to download a PDF of this 6-page file on Aberrant Conduction.
 |
| Figure-11: Aberrant Conduction — Refractory periods/Coupling intervals (from my ACLS-2013-ePub). |
 |
| Figure-12: Aberrant Conduction (Continued) — QRS morphology/Rabbit Ears. |
 |
| Figure-13: Aberrant Conduction (Continued) — Example/Summary. |
==============================