
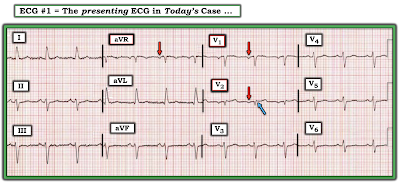
The ECG in Figure-1 was obtained from an older woman with known coronary disease — who presented with shortness of breath and some chest discomfort.
QUESTIONS:
- How would YOU interpret the ECG in Figure-1?
- Is there evidence of new or old septal infarction?
- WHY do you think I am presenting this case?
 |
| Figure-1: ECG from an older woman with known coronary disease — with shortness of breath and some chest discomfort. |
=======================================
NOTE: Some readers may prefer at this point to watch to the 11:00-minute ECG Video PEARL before reading My Thoughts regarding the ECG in Figure-1. Feel free at any time to refer to My Thoughts on these tracings (that appear below ECG MP-77).
=======================================
ECG Media Pearl #77 (11:00 minutes Video) — Reviews assessment of R-Wave Progression as part of the Q-R-S-T memory aid in the Systematic Approach to 12-lead interpretation (includes clarification of PRWP vs delayed Transition).
- Common causes of PRWP (Poor R Wave Progression) are shown below in Figure-2. The fact that conditions as opposite as LVH and RVH may cause "PRWP" — calls into question the clinical utility of this designation. For this reason — I favor simply describing what is seen regarding chest lead QRS appearance, including the zone of Transition (the leads between which the R wave becomes taller than the S wave is deep).
- For more on assessment of R-Wave Progression — Please see ECG Blog #269.
 |
| Figure-2: Common causes of PRWP (See the Video Pearl in today's case!). |
My THOUGHTS on ECG #1:
As always — I approached the ECG shown in Figure-1 systematically (See ECG Blog #205 for my Systematic Approach). My interpretation was as follows:
- Sinus rhythm @80/minute.
- Normal PR and QTc intervals. The QRS appeared to be slightly wide (ie, ~0.11 second) — though not in a bundle branch block pattern.
- There is marked left axis deviation — consistent with LAHB (Left Anterior HemiBlock). As reviewed in ECG Blog #203 — diagnosis of LAHB can usually be made within seconds by appreciation of a predominantly negative QRS complex in lead II, in association with a positive QRS in lead I. NOTE: LAHB may prolong the QRS by 0.01-0.02 second — so this could account for the slight QRS widening.
- No chamber enlargement.
Regarding Q-R-S-T Changes:
- Q waves: Small and narrow q waves are seen in lateral leads I and aVL. Their appearance is consistent with normal septal Q waves. Potentially not so benign are the Q waves seen in leads V1 and V2.
- R wave progression: Transition (ie, the point where the R wave gets taller than the S wave is deep) is either delayed or never occurs in ECG #1 (ie, it's difficult to determine if the R wave in lead V6 is or is not greater than the S wave in this lead). This qualifies as PRWP (Poor R Wave Progression).
- ST-T wave changes: There is nonspecific ST-T wave flattening in multiple leads, that overall does not look acute. That said — What about the positive T wave in lead V2 that potentially is disproportionately tall considering how tiny the QRS complex is in this lead?
So WHY is there PRWP?
As discussed in today's Video Pearl (and as shown above in Figure-2) — there are a variety of potential causes of PRWP. The most relevant potential causes to consider in today's case include:
- LAHB.
- Pulmonary disease.
- Lead misplacement.
- Anterior or anteroseptal infarction.
Why might LAHB (Left Anterior HemiBlock) cause PRWP?
- The bundle of conduction fibers in the LAH (Left Anterior Hemifascicle) lies slightly in front of (anterior to) fibers in the LPH (Left Posterior Hemifascicle). As a result — block in the LAH (as occurs with LAHB) results in an initial posterior direction for electrical activity, that is first conducted over the intact LPH. This often leads to reduction in r wave amplitude in the anterior leads — which may sometimes simulate anterior infarction.
What about COPD (Chronic Obstructive Pulmonary Disease)?
- Severe longstanding pulmonary disease leads to an increase in right ventricular forces. In addition — orientation of the heart’s electrical forces in 3 dimensions may be altered by the large emphysematous chest of a patient with chronic COPD. These physiologic changes may result in ECG signs of: i) Poor R wave progression; ii) Persistence of relatively deep precordial S waves in lateral chest leads; and, iii) Reduced R wave amplitude across the chest leads. In the extreme — R waves are markedly reduced in size (and may even be absent) in anterior precordial leads (See ECG Blog #234 for review on the ECG diagnosis of pulmonary disease and RVH).
WHY am I Presenting this CASE?
The principal reason I chose to present this case — is to highlight lead misplacement as the most likely cause for the Q waves in leads V1 and V2 of Figure-1.
- Chest lead misplacement of leads V1 and V2 is surprisingly common. In an informal study I participated in, in which a series of internet-published examples supposedly illustrating "proper lead placement" were reviewed — more than half of these published examples showed faulty lead placement. That is — instead of proper placement of the lead V1 and V2 electrodes, just to the right and to the left in the 4th ICS (InterCostal Space), as shown in Figure-3 — electrode placement of these 2 leads was in the 3rd, or even as highly placed as the 2nd ICS! Given this frequency of errors among published "teaching examples" — One can only wonder how widespread faulty placement of leads V1 and V3 must really be in clinical practice!
- In my experience over the past decade in reviewing and commenting on acute ECGs posted on numerous international ECG internet forums — emergency care providers commonly fail to recognize this form of lead misplacement.
 |
| Figure-3: Anatomic landmarks for placement of the 6 precordial leads (from Grauer K: ECG-2014-ePub). Note that leads V1 and V2 should be placed in the 4th ICS (InterCostal Space), just to the right and to the left of the sternum. All too often — these leads are placed too high on the chest (in the 2nd or 3rd ICS). |
===========================
3 Clues to Quickly Recognize V1, V2 Misplacement:
Despite the alarming frequency of lead placement errors — the "good news" is that it is EASY to suspect when misplacement of leads V1/V2 is likely! There are 3 clues to look for:
Suspect leads V1 and/or V2 have been placed 1 or 2 interspaces too high on the chest IF one or more of the following clues are present:
- Clue #1 — If there is an r’ in leads V1 and/or V2, especially if the other finding for incomplete RBBB (ie, terminal s waves in lateral leads I and V6) is absent.
- Clue #2 — If there is a significant negative component to the P wave in lead V1 and/or V2.
- Clue #3 — If the appearance of the P wave, QRS complex and ST-T wave in leads V1 and V2 looks very much like the P wave, QRS complex and ST-T wave in lead aVR.
NOTE: As helpful as the above 3 Clues are for quickly suspecting too high placement of leads V1 and/or V2 — these clues are not infallible. There are times when despite our suspicion from looking at an ECG that leads V1 and V2 have been placed too high — this will turn out not to be the case. For example: i) Incomplete RBBB may truly be present (resulting in a terminal r' in leads V1 and/or V2); ii) An all negative, relatively large P wave may sometimes be seen in leads V1,V2 as a normal finding — or — the patient may have true left atrial enlargement; iii) Variation in body habitus and chest wall anatomy may produce unusual ECG findings; and/or, iv) The patient may truly have had prior septal infarction.
- Therefore, my goal in presenting these 3 clues — is that they suggest when to suspect that an unusual anterior lead appearance might best by explained by too-high positioning of lead V1 and/or V2.
- It's EASY to check out your suspicion. Simply verify that chest lead placement is correct — and then REPEAT the ECG!
===========================
TRY OUT these 3 Clues:
ECG "B" in Figure-4 was obtained just a short while after ECG "A".
- WHY did the treating clinician suspect too-high placement of leads V1 and V2 in ECG "A"?
- What changes do you see in the repeat ECG ( = ECG "B") after correcting for erroneous placement of leads V1 and V2?
 |
| Figure-4: Comparison of "before" and "after" tracings — to illustrate ECG findings of too-high placement of the lead V1 and V2 electrodes. (NOTE: I've adapted the 2 ECGs in this Figure from the November 4, 2018 post in Dr. Smith's ECG Blog). |
ANSWERS:
The clinical concern on seeing ECG "A" in Figure-4 — was whether the Q waves in leads V1 and V2 indicated prior septal infarction? The reason too-high placement of the V1 and V2 electrodes was suspected — is that all 3 Clues described above are seen:
- There is a significant negative component to the P waves in leads V1 and V2 (these P waves are all negative in ECG "A").
- There is a small-but-definite terminal r' after the large Q waves in both leads V1 and V2.
- The P wave, QRS and T wave appearance in lead V1 closely resembles the appearance of these deflections in lead aVR.
- In addition — there is a rather abrupt transition from the tiny QRS complexes in leads V1,V2 — to the significantly larger QRST complex with positive P wave in lead V3.
After correcting for erroneous V1,V2 lead placement — ECG "B" now shows:
- Restoration of positive P waves in both V1 and V2 (with the positive P wave in lead V2 now closely resembling P wave morphology in neighboring lead V3).
- Disappearance of the small-but-present terminal r' in leads V1 and V2.
- A completely different P-QRS-T wave appearance for leads V1 and V2 — compared to lead aVR (See Figure-5 for a magnified view of the changes in leads V1,V2 after correction of erroneous lead placement).
- NOTE: I suspect that the position of lead V3 in ECG "A" of Figure-4 may have also been incorrect — since after checking lead placement position and repeating the ECG — there is now (in ECG "B") a predominantly positive QRS complex in lead V3.
 |
| Figure-5: Magnified view of leads aVR, V1 and V2 from Figure-4 — to emphasize ECG findings before and after correcting for too-high placement of leads V1 and V2. Note disappearance of the terminal r' (BLUE arrows in ECG "A") — positivity of the P waves in leads V1,V2 in ECG "B" — and loss of resemblance between the P-QRS-T wave appearance of leads V1,V2 with lead aVR. |
Today's CASE Conclusion:
Let's return to the initial ECG in today's case (Figure-6). I previously listed the 4 conditions most likely to account for the PRWP in ECG #1. These were:
- LAHB.
- Pulmonary disease.
- Lead misplacement.
- Anterior or anteroseptal infarction.
Armed with the 3 Clues for suspecting leads V1,V2 misplacement — Let's now revisit these 4 entities:
- LAHB is present in ECG #1 (See Figure-6). Therefore — this conduction defect may indeed be contributing to the PRWP and lack of initial r wave in leads V1 and V2. The slight QRS widening and presence of LAHB in this tracing could both be the result of this patient's known coronary disease.
- Although we are only provided with limited information about the medical history of today's patient — we are told that this older woman presented with shortness of breath. Poor R wave progression — marked frontal plane axis deviation — and persistence of sizeable S waves through to lead V6 can all be seen with chronic pulmonary disease. That said — other ECG findings of pulmonary disease are not seen in ECG #1 (ie, no right axis; no right atrial enlargement, no right-sided ST-T wave "strain", and no predominant R wave in lead V1). Therefore — I did not suspect chronic pulmonary disease as a significant contributing factor to this patient's PRWP.
- Although the 3 clues to too-high placement of the V1,V2 electrode leads are not all present in ECG #1 — I still suspected that placement of leads V1,V2 was not optimal because: i) The appearance of leads aVR, V1 and V2 all look similar in ECG #1 (ie, predominantly negative, small-amplitude QRS complexes that are each preceded by a relatively sizeable negative P wave [RED arrows in Figure-6]); ii) There is a small-but-definite terminal r' in lead V2 (BLUE arrow) — and it's unusual to see this only in lead V2 but not V1 when lead placement is normal; and, iii) There is an abrupt transition from the tiny QRS complex in lead V2 — to the significantly larger QRST complex with positive R wave in lead V3 (which is now preceded by a positive P wave in lead V3).
- To Emphasize — I can not rule out the possibility of septal infarction of uncertain age in ECG #1. After all — we are told that this older woman has known coronary disease — and that she is now presenting for care because of "chest discomfort". IF electrode lead placement in ECG #1 is accurate — then it would be possible that the Q waves in leads V1,V2 could represent septal infarction — and — that the disproportionately tall T wave in lead V2 could represent an acute change in this patient with new chest discomfort (This T wave is "tall" considering tiny amplitude of the QRS in lead V2).
BOTTOM Line: I suspect that ECG #1 most likely does not represent recent or acute septal infarction. That said — the onus of proof is on us to rule out an acute event, rather than the other way around. Clinically — I would favor the following:
- Verify lead placement — and repeat the ECG. This will immediately tell you IF the reason for the QS in lead V1 and the Qr with surprisingly prominent T wave in lead V2 are "real" — or the result of faulty lead placement. Repeating the ECG will also tell you if there is ongoing evolution of these ECG findings.
- Try to find a prior ECG on this patient (as another way to find out if the ECG findings in leads V1,V2 are recent or acute).
- Get more history (to determine IF a recent or acute event seems likely).
- IF doubt remains — further evaluation (ie, serial troponins, serial ECGs, stat Echo during symptoms looking for localized wall motion abnormality) may all be needed to rule in or out an acute cardiac event.
 |
| Figure-6: I've labeled Figure-1 to highlight ECG findings that suggest possible too-high placement of the V1,V2 electrode leads. |
Final PEARL: Although one should clearly consider the possibility of previous “septal infarction” in the presence of deep Q waves (or QS complexes) in leads V1 and V2 — in the absence of another Q wave (or QS complex) in lead V3 — the vast majority of patients with Q waves in V1 and V2 but not V3, will not have prior “septal” infarction.
- Clinical correlation, comparison with prior tracings, and verification of correct lead placement would all be needed for optimally accurate comment on the likelihood of prior septal infarction in such cases.
==================================
Acknowledgment: My appreciation Sarah Johnson Saunders (from North Carolina, USA) for making me aware of this case and allowing me to use this tracing.
==================================
Related ECG Blog Posts to Today’s Case:
- ECG Blog #205 — Reviews my Systematic Approach to 12-lead ECG Interpretation (outlined in Figures-2 and -3, and the subject of Audio Pearl MP-23-LINK in Blog #205).
- ECG Blog #269 — Reviews assessment of R-Wave Progression (including the causes of "Poor" R wave progression).
- ECG Blog #203 — Reviews the basics for assessing Axis + a user-friendly approach for the ECG diagnosis of the Hemiblocks (with text and Video Pearls on these 2 subjects).
- ECG Blog #234 — Reviews the ECG diagnosis of RVH and Pulmonary Disease.
- ECG Blog #218 — Reviews when a T-Wave is Hyperacute.
- The November 4, 2018 post in Dr. Smith's ECG Blog — from which the tracings in Figure-2 and Figure-3 of today's case are taken.
Thank you so much. I had a similar case in my practice today. Greetings from an internist, living in Serbia
ReplyDeleteMy pleasure. Glad the case was helpful to you! — :)
Delete