Friday, December 28, 2018

ECG Blog #159 — Unrelated Ps & QRS Complexes?


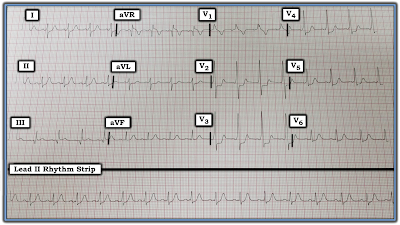
The lead II rhythm strip in Figure-1 was obtained from a middle-aged woman who presented to an out-patient clinic with non-cardiac chest pain.
  • What do you see?
  • Does this patient have a cardiac problem?

Figure-1: ECG obtained from a middle-aged woman with non-cardiac chest pain. What do you see? 


=========================
NOTE: The rhythm strip was recorded at the standard speed of 25mm/second. There is slight distortion (slanting) of the tracing. This is unfortunate — because it makes it much more difficult to assess differences in interval duration, which turns out to be very important in this case. That said, the “good news” is that despite this technical shortcoming — we still are able to determine what is going on with this tracing.
  • We outline our step-by-step process of analysis below.

=========================
Interpretation: The QRS complex is narrow in this single monitoring lead — so the rhythm appears to be supraventricular. At first glance — the rhythm in Figure-1 looks to be fairly regular. P waves are present — but it looks like the PR interval does not remain constant throughout the tracing.
  • PEARL #1: When confronted with a difficult rhythm strip — 2 simple measures greatly facilitate both interpretation, as well as explanation of your approach to others: iNumber the beats in the tracingand, ii) Label atrial activity with arrows. Numbering the beats saves time and effort — because without this, one is never certain as to which beat is being referred to. Labeling P waves allows you to determine IF there is an underlying sinus rhythm (RED arrows in Figure-2). I have been amazed at how often (and how quickly) simply labeling sinus P waves makes underlying relationships obvious.
  • NOTE: Please do not mark up the original rhythm strip with arrows or other notations. The rhythm strip is an official medical record — and if your initial theory turns out to be wrong — then you can’t erase ink markings … So best to make a COPY of the tracing — and then feel free to write on that copy as much as desired.

Figure-2: We have numbered the beats and labeled P waves (RED arrows). How would you describe the relationship between P waves and QRS complexes in this rhythm strip?


QUESTION: Take a good look at Figure-2. A fairly (but not completely) regular atrial rhythm is evident (RED arrows).
  • How would you describe the relationship between P waves and QRS complexes in Figure-2?


ANSWER: As noted above — there appears to be a fairly regular supraventricular (ie, narrow QRS) rhythm in Figure-2:
  • PEARL #2: When dealing with a complex rhythm — Start with what you KNOW! We know the PR interval preceding beat #3 is too short to conduct. The PR interval preceding beats #2 and #6 also appears to be too short to conduct.
  • Next  Ask yourself IF there is an underlying sinus rhythm? Note that the PR interval preceding all other beats on this tracing (ie, the PR interval before beats #1; 4,5; 7,8,9) is longer than the PR interval preceding beats #2,3,6 (Figure-3). As alluded to earlier — P waves in this tracing are slightly irregular. But because the PR interval is equal and normal (~0.14 second) preceding beats #1; 4,5; and 7,8,9 — and since P waves are all upright in this lead II monitoring strip — the underlying rhythm is sinus arrhythmia. Since the overall heart rate is under 60/minute — there is also bradycardia.
  • Since the 3 beats that are preceded by a PR interval too short to conduct all have a narrow QRS and look similar in morphology to the 6 sinus-conducted beats on this tracing — these 3 beats (ie, beats #2,3,6) must be junctional escape beats.

Figure-3: The PR interval preceding beats #2, 3 and 6 is too short to conduct (WHITE arrows). In contrast — the PR interval preceding all other beats on this tracing is equal and normal (RED arrows) — which tells us that the underlying rhythm is sinus (technically sinus bradycardia and arrhythmia — See text).


QUESTION: Look at Figure-3.
  • Is there AV dissociation?
  • If so — Is there AV block?


ANSWER: By definition — there is transient AV Dissociation in Figure-3. That’s because, at least for some brief period of time — there are some P waves that are not related to neighboring QRS complexes!
  • PEARL #3: Just because there is transient AV dissociation does not necessarily mean there is AV block! It is important to realize that there are 3 potential Causes of AV Dissociation: i) AV dissociation due to some form of 2nd or 3rd degree AV Block; iiAV dissociation by Usurpation” — in which P waves transiently do not conduct because an accelerated junctional rhythm takes over the pacemaking function (because it is faster than the underlying sinus rhythm); and/or, iiiAV dissociation by Default” — in which a junctional escape rhythm takes over by “default” (ie, because of SA node slowing).
  • PEARL #4: The term, “AV Dissociation” — should never be used as a “diagnosis” per se. Instead — optimal rhythm diagnosis indicates there is AV dissociation because of whichever one or two of the 3 potential causes of this phenomenon is (are) operative. For example, there may be “AV dissociation by usurpation” with Digitalis toxicity — because an overly high dose of Digoxin commonly results in an accelerated junctional rhythm, that then “usurps” control of the underlying sinus rhythm (that is beating at a slower rate).
  • PEARL #5: There is no evidence of AV block in Figure-3. In order for there to be 2nd or 3rd-degree AV block — at least some atrial impulses must fail to conduct to the ventricles despite having adequate opportunity for conduction to occur. This never happens in Figure-3. That’s because the P waves preceding beats #2, 3 and 6 never have a chance to conduct, since the PR interval preceding these beats is clearly too short to allow conduction. The only way to determine if some form of AV block might be present in this patient — would be to see a much longer period of monitoring. One needs to see P waves occurring at all points in the cycle at a slow enough rate (usually under 50-60/minute) — before one can judge if some of these P waves are not being conducted despite having adequate opportunity to do so.


QUESTION: Take another look at Figure-3.
  • Why is there AV dissociation?
  • What are the clinical implications of this finding?
  • And — What is the rhythm in Figure-3?


ANSWER: To address these final questions — we measure all R-R intervals on the tracing (Figure-4).
  • PEARL #6: You cannot accurately interpret complex arrhythmias unless you regularly use Calipers. IF you have not yet incorporated regular use of calipers into your practice — You will be amazed at how doing so instantly makes you not only “smarter” — but much faster in your assessment of complex arrhythmias.

Figure-4: Using calipers — we have measured all R-R intervals on this tracing (See text).


PEARL #7: When confronted with a rhythm strip in which there is transient AV dissociation, and you are not certain as to which beat(s) may be conducting — Look for unexpected shortening of the R-R interval. Such shortening usually indicates which beat(s) is being conducted.
  • Most of the time, such shortening will be obvious. However, it is not at all obvious in Figure-4. That said, we can see from our measurements that all sinus-conducted beats in Figure-4 (ie, all beats preceded by P waves with RED arrows) have a shorter preceding R-R interval (ie, between 6.1-to-6.5 large boxes) than the R-R interval preceding the 3 junctional escape beats.
  • The R-R interval preceding all 3 junctional escape beats on this tracing = 6.6 large boxes, which corresponds to a junctional escape rate of about 45/minute (ie, 300 ÷ 6.6). This is appropriately within the 40-60/minute normal range for a junctional rhythm.
  • The R-R interval preceding the sinus-conducted beats in Figure-4 is between 6.1-to-6.5 large boxes. This corresponds to a sinus bradycardia and arrhythmia with a rate between 46-49/minute.

P
EARL #8: The above measurements tell us that what we are seeing in Figure 4 is ADissociation by Default” (ie, whenever the sinus pacemaker slows to a rate below 46/minute — the junctional escape rhythm takes over at the appropriate junctional escape rate = 45/minute).
  • NOTE: The rhythm in Figure-4 is not “AV dissociation”. Instead, the rhythm is sinus bradycardia and arrhythmia. It is because of this sinus bradycardia that AV dissociation occurs. And, since we never see P waves that fail to conduct despite having a chance to conduct — there is no evidence on this tracing of any form of AV block ...

P
EARL #9: The clinical implications of the rhythm in Figure-4 depend on the reason for sinus bradycardia. The cause might be iatrogenic — if for example the patient was taking a medication such as a ß-blocker that may overly slow the sinus rate. If this were the case — all that might be needed could be to stop the drug (or reduce the dose). If this resulted in a slightly faster underlying sinus rate — there might no longer be need for a junctional escape rhythm to take over the pacemaking function.
  • Another potentially benign cause for the rhythm in Figure-4 could be that the patient is a completely healthy endurance athlete, with a “normal-for-her” rhythm of sinus bradycardia and arrhythmia. An intermittent junctional rhythm under such circumstances may be a normal response in a patient without any pathology.
  • On the other hand — the reason for sinus bradycardia and arrhythmia might be SSS ( = Sick Sinus Syndrome) — and, perhaps with a longer period of monitoring, evidence of AV block (or more profound sinus rate slowing) might be seen ...


BOTTOM Line: Clinical correlation and a longer period of monitoring is essential for determining IF the rhythm in Figure-4 is pathologic or not. This rhythm might represent a normal, physiologic response in this middle-aged woman with non-cardiac chest pain. Potentially, no other interventions might be needed for such a rhythm. On the other hand — further evaluation might reveal this rhythm to be pathologic and mandate a pacemaker.
  • Optimal interpretation for the rhythm in Figure-4 should be: “Sinus bradycardia and arrhythmia, that results in AV dissociation by default — but without evidence of AV block on this tracing”. Optimal management to determine what (if anything) need be done — will depend on clinical correlation.

-------------------------------------------------------------------------
Acknowledgment: My thanks to Dr. Wai Shein from Kyaukpadaung, Myanmar, for his permission allowing me to use this tracing and clinical case.
-------------------------------------------------------------------------


NOTE: For more on the Basics of AV Block — Please CLICK HERE. My discussion on AV Dissociation begins at 49:25 in this hour-long ECG video.
  • For written material regarding the difference between AV Dissociation vs AV Block — See also ECG Blog #21 and/or Section 20 in our ACLS-2013-ePUb.
  

Sunday, December 23, 2018

ECG Blog #158 (STEMI – OMI – Ischemia – ST depression – not acute)

Imagine the ECG in Figure-1 was obtained from a previously healthy, middle-aged man who presented to an ambulatory clinic for “indigestion”.
  • How would you interpret this ECG in light of the above history?
  • Are there acute changes?
Figure-1: Imagine this ECG was obtained from a previously healthy, middle-aged man with “indigestion”. How would you interpret this tracing? NOTE Enlarge by clicking on the Figure.
========================
Interpretation: The rhythm for the ECG shown in Figure-1 is sinus at a rate of ~70/minute. All intervals are normal. The mean QRS axis is normal (about +30 degrees — as judged by the upright QRS in leads I and aVF, with greater net positivity in lead in lead I). There is no chamber enlargement. Regarding assessment of Q-R-S-T Changes:
  • A large Q wave is seen in lead III — and small q waves are present in leads II and aVF.
  • Transition is normal (occurs between V3-to-V4).
  • There is coved ST elevation in leads III and aVF — with a hint of early T wave inversion in these leads. There also appears to be slight-but-real ST elevation in lead II (See below).
  • ST depression is seen in lead I (slightly), and in lead aVL (more definite— and probably also in lead V2.
  • The T wave is relatively flat in leads V5 and V6 (normally the T wave is clearly upright in these lateral chest leads).
IMPRESSION: The combination of findings described above suggests we should assume inferior MI (Myocardial Infarctionhas occurred at some point, most probably in the recent past — at least, until proven otherwise. The challenge is to determine the probable age of this MI. We highlight the following points:
  • PEARL #1: I like using the concept of patterns oleads” — especially when assessing the ECG of a patient suspected of acute ischemic heart disease. To apply this concept — Look at all leads that view a given area of the heart at the same time. Thus, we look here at the 3 inferior leads (II,III,aVFat the same time (Figure-2). Given that 2 of these leads (ie, leads III and aVF) clearly show Q waves + ST elevation + beginning T wave inversion — it becomes exceedingly likely that the much more subtle findings in lead II are also real. These findings in lead II consist of ST elevation (RED arrow pointing to the ST segment which lies above the RED horizontal baseline in this lead and — and the small q wave (within the RED circle).
  • PEARL #2: With acute coronary disease — an almost magical” reciprocal (= mirror-imagerelationship will usually be seen between ST-T wave deviations in leads III and aVL. To illustrate this concept — I have placed the mirror-image of the first 2 beats in lead III just over the complexes in lead aVL — and, the mirror-image of the first 2 beats in lead aVL just over the complexes in lead III. Recognition of this “almost magical” reciprocal relationship (as we see here in Figure-2virtually confirms acute (or at least recent) changes of MI.
  • Reciprocal ST flattening/depression is also seen in leads I and V2 in Figure-2 — albeit quite modest in degree. In the setting of acute or recent inferior MI — ST depression in anterior leads (ie, V1, V2 and/or V3) typically indicates posterior wall involvement — so we suspect infero-postero MI in this case.
  • PEARL #3: It is uncommon for the amplitude of a positive T wave in lead V1 to be greater than the amplitude of the positive T wave in lead V6. When this relationship is seen in a patient with potentially acute symptoms (as is the case in Figure-2) — acute ischemia is likely.
  • NOTE — There may also be RV (right ventricular) involvement in this case. Lead V1 is both an anterior, as well right-sided lead. Proximal RCA (Right Coronary Artery) occlusion often results in acute infarction of the 3 areas of the heart supplied by the RCA, which are the inferior and posterior wall of the LV (left ventricle), and the RV (right ventricle). Diagnosis of acute RV MI is often challenging on a standard 12-lead ECG — because the expected right-sided ST elevation is frequently cancelled out by anterior ST depression from associated posterior MI. While we might suspect this as the reason for the modest amount of anterior ST depression and the upright T wave in lead V1 of Figure-2 — the only way to know if there is RV involvement in this case would be with right-sided leads (ie, leads V1R-thru at least V4R).
Figure-2: We have labeled Figure-1 to highlight subtle changes in lead II — and the “magic” reciprocal (mirror-image) relationship with acute or recent coronary disease between leads III and aVL (See text).
========================
BOTTOM Line: The ECG in Figure-2 strongly suggests that there has been an Infero-Postero MI (possibly also with RV involvement). But the question remains as to whether this is acute (ie, within the last couple of hours— recent (within the past day or two or three … — or more remote than just a few days ago?
  • Treatment recommendations for this patient will vary dramatically depending on the acuity of the MI. For example, immediate cardiac catheterization and/or thrombolytic therapy are less likely to be helpful if much time has passed since the acute event.
  • The History in this case is very important. Because the area of the heart viewed by the inferior leads (especially leads III and aVF) lies on top of the diaphragm — it is not at all uncommon for patients with inferior MI to present with GI symptoms. If this is in fact the case here — it will be important to try to elicit from the history WHEN this patient’s “indigestion” began.
  • ECG findings in Figure-1 that suggest a more acute STEMI (= ST Elevation MI are: ithat there is ST elevation in each of the inferior leads; iithat there is reciprocal ST depression, including that “magical” mirror-image picture for the ST-T waves in leads III and aVL; and, iii) that T wave inversion looks like it might only be beginning ...
  • On the other hand, ECG findings that suggest a LESS acute picture include: ithat the overall amount of ST elevation is relatively modest; iithat a very large Q wave has already formed in lead III; iiithat the amount of reciprocal ST depression is also extremely modest; and, ivthat the patient presented to an ambulatory clinic instead of to an ED (Emergency Department). While it certainly occurs that patients with acute MI can present to an ambulatory clinic — I’ve observed over the years a “self-selection” process, whereby statistical likelihood of an acute event seems greatly enhanced when patients call 911 and present with their symptoms to the ED instead of to an outpatient clinic.
=============================
MBEST Guess: Pending additional historical information — the seemingly uncertain onset of GI complaints + outpatient presentation + an ECG with a very large Q wave in lead III + relatively modest amount of ST elevation and depression all suggest a less acute onset for this MI. Whether this dates the infarct as having occurred 12-24 hours ago, or even longer ago than that — is uncertain from the information available.
  • That above said, one can not rule out a more acute onset — especially if the reason for relatively little ST elevation is spontaneous reperfusion (in which case, the risk of potential reocclusion may be considerable).
  • To emphasize — clinical priorities and the treatment approach would be very different IF the history suggested a recent and/or ongoing onset. For example, prompt cath to define the anatomy would be indicated if the patient had called 911 and/or presented to the ED with new-onset chest pain ... Sometimes, "Ya gotta be there" to fully appreciate the clinical situation.
  • In Summary prompt assessment and more information is needed to determine true risk of this patient.
-------------------------------------------------------------------------
-------------------------------------------------------------------------
  • NOTE: For more on our approach to dating an infarct — Please see our ECG Blog #142.

Saturday, December 15, 2018

ECG Blog #157 (RBBB - WPW - RVH - Post MI)

The ECG in Figure-1 was obtained from a 35-year old man with a 20-pack year history of smoking — who presented with new-onset chest discomfort. He was hemodynamically stable at the time this tracing was obtained. 
  • How would you interpret his ECG?
  • Is there RBBB?
  • Should the cath lab be activated?

Figure-1: ECG obtained from a 35-year old man with new-onset chest discomfort. Should the cath lab be activated?


=============================
Interpretation: There is a regular sinus rhythm in Figure-1 at a rate of ~90/minute. At first glance, the PR interval looks normal — but the QRS complex looks wide, with a pattern in lead V1 that suggests RBBB (Right Bundle Branch Block). That said, this is not RBBB. Why not?
=============================


ANSWER: The pattern of QRS widening with the upright complex in lead V1 is not the result of RBBB. The reason for this is highlighted by the RED arrows in Figure-2, which point to delta waves that are evident in leads I and V2-thru-V5. This patient has WPW (Wolff-Parkinson-White) Syndrome.
  • Delta waves are not obvious in a number of leads on this tracing. This is especially true in several of the limb leads. It was only after I saw unmistakable slurring of the initial part of the QRS complex in certain leads (most evident in leads V2, V3 and V4) — that I realized this patient has WPW.
  • PEARL #1: Delta waves are not always seen in all 12 leads of the ECG when a patient has WPW. As a result, it can sometimes be quite challenging to make the diagnosis. This problem is complicated by the reality that some patients (more common in older individuals) normally manifest some initial slowing (and therefore slurring) of the early part of the QRS complex. BOTTOM LINE: When contemplating the possibility of WPW — all 12 leads should be carefully scrutinized. If questionable initial slurring is minimal and only noted in 1 or 2 leads — then the patient probably does not have WPW. But if unmistakable delta waves associated with a short PR interval are definitely seen (as is highlighted by the RED arrows in leads V2, V3 and V4 of Figure-2) — then you have made your diagnosis despite the absence of obvious delta waves in some of the other leads.
  • PEARL #2: Once you determine the patient has WPW — you’ll often be able to GO BACK and recognize subtle deflections that in retrospect are also delta waves. For example, in Figure-2 — I initially thought there was a Q wave in lead III (WHITE arrow). However, the fact that this negative deflection in lead III occurs at precisely the same instant in time as the delta wave in simultaneously-obtained lead I (dotted WHITE line, leading up to the RED arrow in lead I) — tells us that this negative deflection in lead III is actually a negative delta wave.
  • This illustrates why WPW is often referred to as, “the great ECG mimic” — because WPW may simulate a number of ECG findings, including myocardial infarction (if there are multiple negative delta waves), as well as chamber enlargement, ischemia, and conduction defects! Thus, there is no RBBB in Figure-2 — because this patient has WPW.
  • Other examples of “retrospective recognition” of delta waves in Figure-2 are seen in leads II, aVL, and aVF. Thus, the suggestion of a tiny “extra little bump” on the baseline in leads II and aVF probably represents subtle delta waves that are almost entirely isoelectric.

Figure-2: We have labeled Figure-1 to explain why there is no RBBB. But what about the ST depression within the WHITE rectangles? Should the cath lab be activated? NOTE: Although the ECG is not straight, and the grid lines are slanted — we have drawn the dotted WHITE line parallel to the heavy grid line just before it, to show simultaneously-occurring events in leads I, II and III. (See text).


=============================
ECG Findings with WPW: When the rhythm is sinus — conduction of the electrical impulse in a patient with WPW begins as usual in the SA node. From there, the impulse may be conducted to the ventricles in one of 3 ways:
  • Possibility #1: Entirely over the AP (Accessory Pathway— in which case the AV node will be completely “bypassed”, resulting in: ia delta wave (due to slow conduction through nonspecialized myocardial tissue); iia short PR interval (since the usual delay in conduction inherent within the AV node is bypassed); and, iiia wide QRS complex (from slowed conduction through the ventricles— OR —
  • Possibility #2: Conduction to the ventricles with WPW may at times be entirely over the normal AV nodal pathway (in which case there will be no delta waves on the ECG; the PR interval will be normal; and the QRS complex will be narrow and look normal) — OR —
  • Possibility #3: There may be simultaneous conduction over both the AP and the normal AV nodal pathway! If relatively more conduction occurs over the AP — then the QRS complex will be wide, and there will be delta waves and a short PR interval. If instead, preexcitation is limited so that conduction occurs primarily over the normal AV nodal pathway — then the features of WPW may be subtle, and you may not even realize that an AP exists. But, if a significant amount of conduction is simultaneously transmitted over both the AP and the normal AV nodal pathway — then the resultant PR interval and QRS complex may reflect features intermediate between normal and preexcited complexes.
=============================
NOTE: For more on the ECG features of WPW, as well as clinical implications when WPW is found in an asymptomatic patient — Please see our ECG Blog #153.
=============================

QUESTION: What about the marked ST segment depression seen within the WHITE rectangles in Figure-2 (BLUE arrows)? Is this ST depression that is seen in most chest leads reflective of ischemia in this 35-year old man with new chest discomfort? — OR — Are we unable to assess the significance of this finding because this patient has WPW?
  • KEY POINT: In general — assessment of ST-T wave deviations (elevation or depression) do not reliably predict underlying ischemia or infarction when there is considerable preexcitation. This is because since the sequence of depolarization is altered by WPW — the sequence of repolarization (and therefore the appearance of ST-T waves) will also be altered. That said, the shape and amount of ST depression within the WHITE rectangles in Figure-2 is so pronounced — that one wonders if despite the presence of WPW, this ST depression might nevertheless indicate acute ischemia?

=============================
Follow-Up: The cardiologist involved in the case was as uncertain as I am looking at this ST depression (within the WHITE rectangles) — as to whether it is a marker of acute ischemia, or simply an accompaniment of this patient’s WPW. Given this patient’s history ( = risk factors + new-onset chest pain) — cardiac catheterization was performed. The coronary arteries were free of significant disease.

-------------------------------------------------------------------------
COMMENT: Most of the time, you will not be able to appreciate ischemia or acute infarction on the ECG of a patient with WPW. That said, on occasion — ST-T wave changes may be so marked as to suggest acute disease, necessitating cardiac cath to define the anatomy. This was the situation in this case.

-------------------------------------------------------------------------
Acknowledgment: My thanks to Dr. Ahmed Abbas from Amman, Jordan, for his permission allowing me to use this tracing and clinical case.
-------------------------------------------------------------------------
-------------------------------------------------------------------------
  • NOTE: For more on the ECG features of WPW, as well as clinical implications when WPW is found in an asymptomatic patient — Please see our ECG Blog #153.
  • CLICK HERE — for a link to Dr. Stephen Smith's ECG Blog post from March 1, 2012, in which he shows a series of WPW tracings which either mimic, hide or reveal acute MI.