Friday, December 31, 2010

ECG Interpretation Review #11 (BBB, Wide QRS, ST Changes with BBB, LBBB vs RBBB, LVH)


QUESTION: Interpret the 12-lead ECG below.
  • What type of conduction defect is present?
  • Are ST-T waves doing what you'd expect given the presence of this conduction defect?
  • Clinically - What else may be going on? (Is there LVH? - evidence of infarct?)

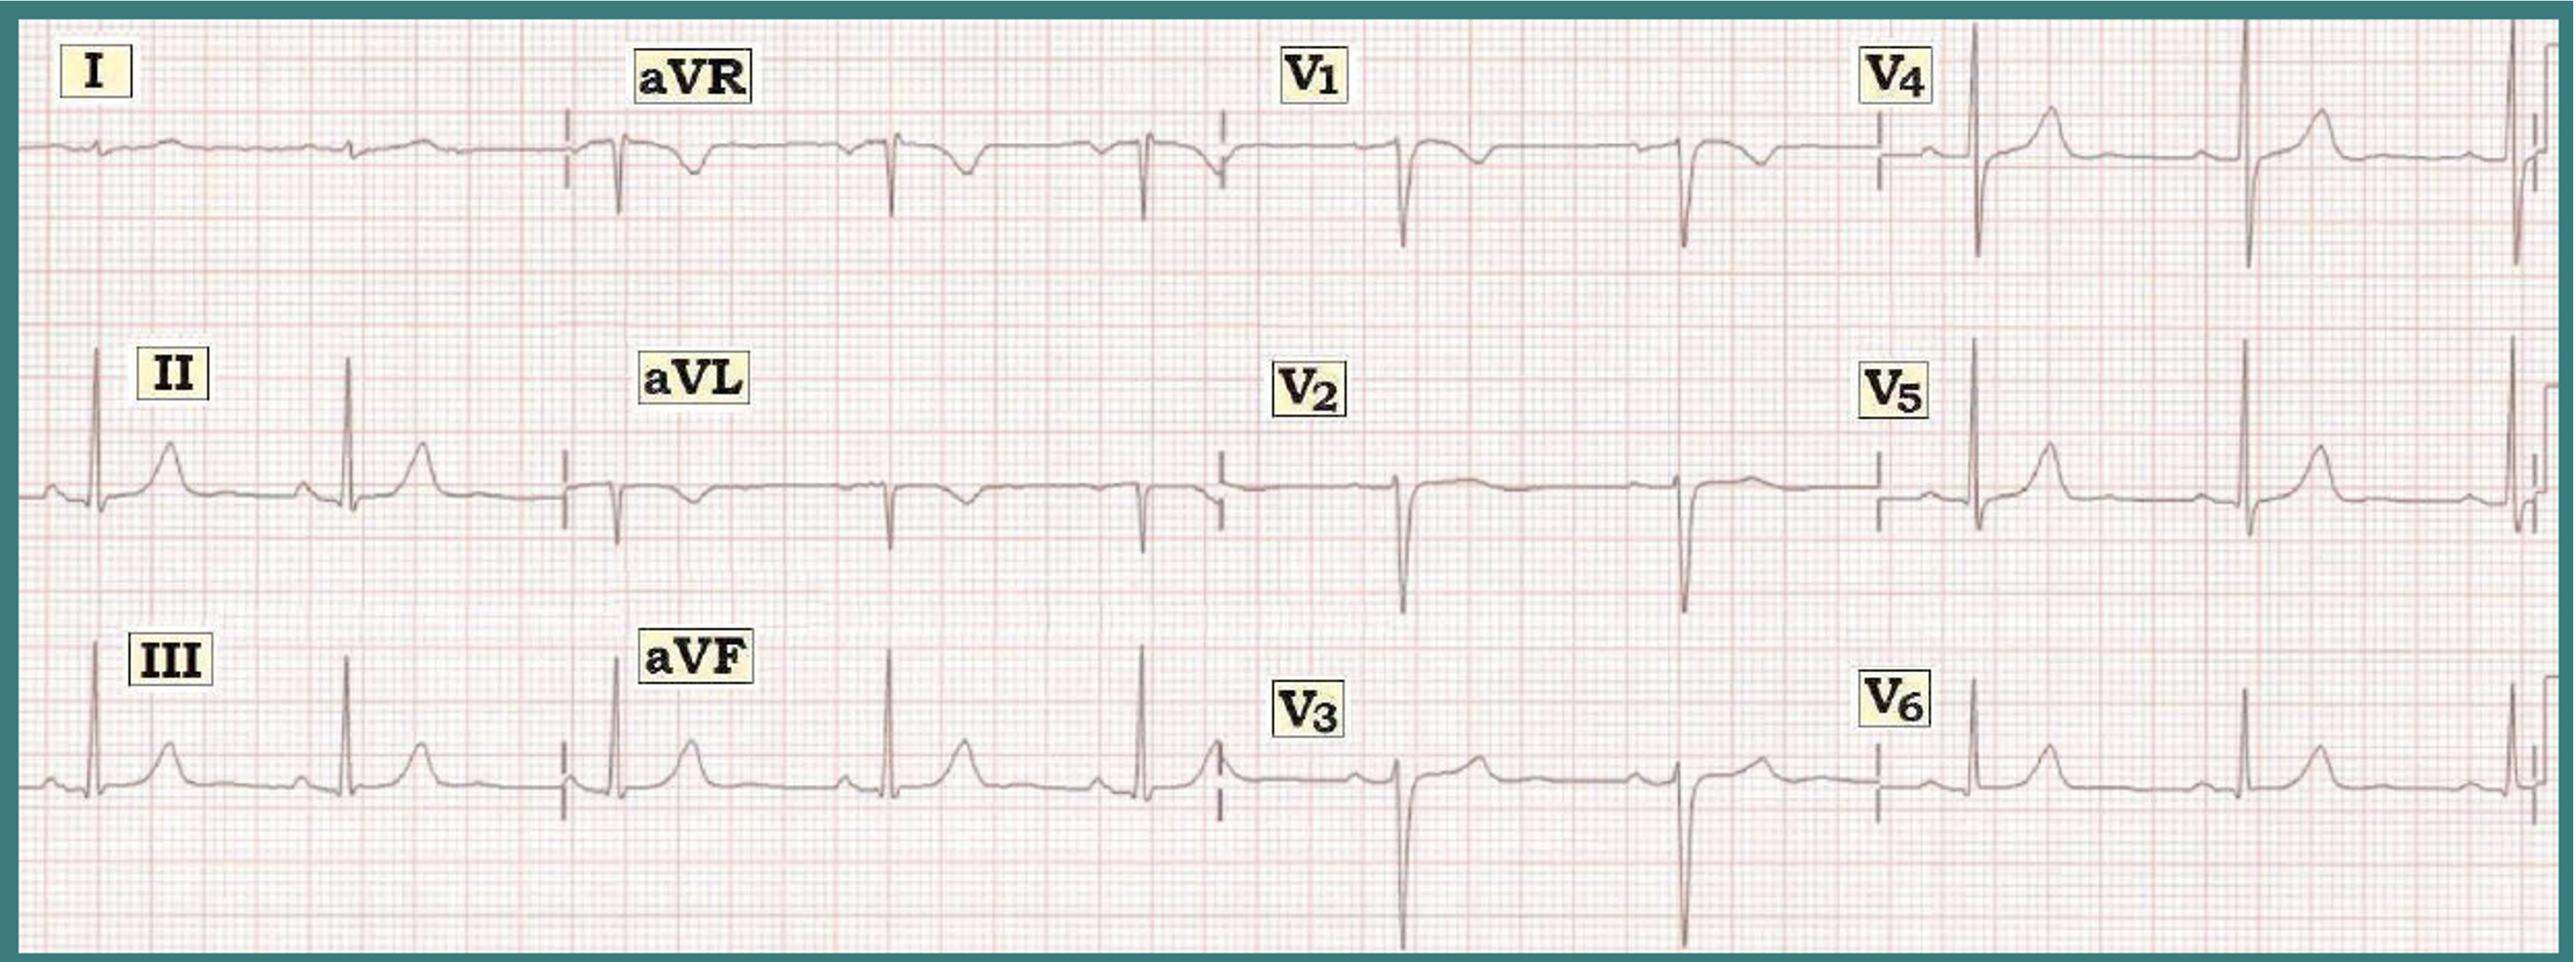
Figure 1: What type of conduction defect is present?


INTERPRETATION:  The rhythm is regular at a rate just over 100/minute.  This qualifies the rhythm as sinus tachycardia at 102/minute. The PR interval is normal (ie, not more than a large box in duration). The QRS is obviously long.  Recognition of QRS widening at this point is indication to STOP (and figure out WHY the QRS is wide) - before going any further:
  • Assessment of QRS WideningThe 3 KEY leads to assess in order to determine the reason for QRS widening are leads I, V1, and V6.  We look first at left-sided Leads I and V6 - which both show a wide monophasic R wave (albeit with slight slurring on the downslope in lead I).  Right-sided Lead V1 shows an entirely negative QS complex.  QRS morphology is therefore consistent with complete LBBB = Left Bundle Branch Block (See Figure 2 and LBBB Criteria below).
Figure 2 - Typical Morphology for LBBB.


Criteria for LBBB (illustrated above in Figure 2):
  • QRS widening to at least 0.12 second (whereas complete RBBB can occur with a slightly lesser degree of QRS widening = 0.11 second!).
  • An upright (monophasic) QRS in leads I and V6 that may (or may not) be notched.  But there should not be any q wave in either lead I or lead V6!
  • A predominantly negative QRS in lead V1.  There may (or may not) be an initial small r wave in lead V1 (lead V1 may show either a QS or rS complex).
Returning to Our Systematic Approach: The QT interval is less relevant in the setting of BBB (BBB by itself may prolong the QT). The axis is normal (close to 0 degrees) - albeit the concept of axis usually means little in the setting of BBB.  
  • Chamber Enlargement - There is probable LVH (See Impression below).
  • Q-R-S-T Changes - There appears to be a Q wave in lead III.  Otherwise - typical secondary ST-T wave changes are seen, consistent with the conduction defect (See KEY Rule and Figure 3 below).

------------------------------------
KEY Rule — Normally when there is typical RBBB or LBBB - the ST segment and T wave should be oriented opposite to the last QRS deflection in the 3 KEY leads (arrows in Figure 3). Deviation from this pattern in any of the KEY leads (I, V1 or V6) is abnormal - and indicates a primary ST-T wave change (suggesting ischemia or infarction may be occurring).  

Figure 3 - ST-T Wave Changes Expected with BBB.
Note - The above KEY Rule for ST-T wave direction works only for RBBB and LBBB (but not for IVCD).
  • In Figure 1 - ST-T waves are as expected for typical LBBB (ie, opposite to the last QRS deflection in each of the 3 KEY leads).  Note that even the dramatic T wave peaking (with ST elevation) in anterior precordial leads of Figure 1 is as expected for LBBB. Lateral ST depression seen here is also not ischemic, but rather typical for LBBB. 
CLINICAL IMPRESSION:  We interpret this ECG as showing sinus tachycardia with complete LBBB - but no acute changes. Clinical correlation (and comparison with prior tracings) is needed to determine the significance of these changes, and whether they are new.
  •  It is always more difficult (but not necessarily impossible) to assess for ischemia and infarction when there is LBBB.  Two important clues we routinely look for in this assessment are: i) the presence of typical secondary ST-T wave changes of BBB (See KEY Rule and Figure 3) - and ii) that no Q wave is seen in any lateral lead (there should be a monophasic R wave but no q wave with uncomplicated LBBB - as is seen in leads I, aVL, and V6 of Figure 1). The Q wave in lead III and the QS in lead V1 of Figure 1 are not indicative of infarction given the presence of BBB.
  • Finally - It is also more difficult to assess for ventricular enlargement in the setting of LBBB. That said - the statistics are that many (if not most) patients with LBBB also have significant underlying heart diseasae (longstanding hypertension, heart failure, cardiomyopathy, coronary artery disease). By dint of their disease - many of these patients also have LVH (Left Ventricular Hypertrophy). The chance of true chamber enlargement with LBBB is extremely high (approaching 90%) - IF one finds very deep S waves (>25-30 mm) in leads V1, V2, or V3 and/or IF one finds LAA (Left Atrial Abnormality) in addition to LBBB. Given the appearance of Lead V2 in Figure 1 - we suspect there is probable LVH in this patient with complete LBBB.
--------------------------------------------------------
   - See also ECG Blog Review #3 - and Review #13 - 
   - Please check out our ECG Video on Basics of Bundle Branch Block (www.bbbecg.com)
--------------------------------------------------------

Friday, December 24, 2010

ECG Interpretation Review #10 (Peaked T Waves, Ischemia vs Hyperkalemia vs Normal Variant)

QUESTION: Interpret the 12-lead ECG below, obtained from an older patient with multiple medical problems (and on multiple medications).
  • Clinically  What do you suspect is going on?
  • Is there ECG evidence of ischemia? (What will have to happen before you'll be able to answer this question? )

Figure 1: ECG obtained from an older patient with multiple medical problems.


INTERPRETATION:  The rhythm is sinus at a rate just under 100/minute. The PR and QRS intervals are normal.  The QT looks to be about half the R-R interval, so that it is borderline prolonged. The axis is abnormal. The small amplitude but predominantly negative QRS complex in lead I indicates RAD (Right Axis Deviation) of at least +100 degrees.  There is no chamber enlargement.
  • Q-R-S-T Changes  There appear to be Q waves in leads I,aVL  and QS complexes in V1,V2.  Transition may be slightly delayed, with the QRS becoming more positive only in lead V5. However, the most remarkable finding are the very tall, peaked T waves with narrow base ("Eiffel Tower" effect) in several precordial leads (Figure 2).  This strongly suggests Hyperkalemia.  In addition  T waves are inverted sharply in leads III and aVF of Figure 1, and there is some straight ST segment depression in inferior and anterolateral leads.

Figure 2: Blow-up of Figure 1 — showing tall, peaked T waves ("Eiffel Tower effect" ) of hyperkalemia.


Clinical PEARL: The ECG is the net result of the heart's electrical activity. It is difficult to know the clinical significance of RAD and the ST depression/T wave inversion seen here given the setting of superimposed hyperkalemia.  One will not know the "true" ECG story until the electrolyte disorder (and the ECG changes of hyperkalemia) have been corrected . . .
  • Axis deviation  QRS widening with changes in QRS morphology  and peaked T wave inversion are all examples of ECG abnormalities that may simply be due to the hyperkalemia.

--------------------------------
ECG Changes of Hyperkalemia: In general  the ECG correlates well with the degree of serum potassium elevation  (Figure 3).

Figure 3:  ECG Manifestations of Hyperkalemia.

  • Panel   shows a normal ST-T wave.
  • Panel   T wave peaking is the earliest change of hyperkalemia.
  • Panel C  The T wave becomes taller and more peaked (K+ ~ 7-8 mEq/L); it almost looks like the Eiffel Tower (tall, peaked, with narrow base in contrast to the T wave that is sometimes seen in healthy individuals (lower right box in Figure 3), in which the T wave is rounded, its sides are not symmetric, and it has a broad base.
  • Panel D  P wave amplitude decreases, the PR interval lengthens, and the QRS widens (K+ >8 mEq/L).
  • Panel E  P waves disappear (sinoventricular rhythm) and the QRS becomes sinusoid (K+ >10 mEq/L).  V Fib usually follows.
--------------------------------
    Final Point: All that produces tall, peaked T waves is not necessarily hyperkalemia! Instead, the finding of Twave peaking should prompt one to consider a differential diagnosis of 3 possible causes  with the clinical situation (as well as specific ECG features) providing KEY clues as to which of the 3 is likely to be present.
    1. HyperkalemiaSuspect as the cause of T wave peaking when the clinical setting is one likely to produce hyperkalemia (ie, renal failure, volume depletion, acidosis, potassium-retaining drugs and  when T waves are tall, pointed with steep ascent and near equally steep descent with a narrow base (as seen in Figure 2 ).
    2. Normal (RepolarizationVariantSuspect when T wave peaking has a more rounded summit with assymetric ascent and descent and a broader base  especially IF the patient is otherwise healthy and without any apparent reason to have hyperkalemia (We saw this in Figure 1 of ECG Review #6).
    3. IschemiaAlthough a much less common cause of T wave peaking than hyperkalemia and normal repolarization variants  it should be appreciated that myocardial ischemia (in the area of the left ventricular posterior wall) may sometimes present with the ECG finding of tall, peaked T waves in the anterior leads. Be aware of ischemia as a possible cause of T wave peaking in leads V1,V2,V3 when a patient with known (or suspected) coronary artery disease presents with chest pain  especially if there is other evidence on the tracing to suggest ischemia or infarction (ie, inferior T wave inversion or ST depression).

    ----------------------------------------------------


    -------------------------------------------------------------------------------------

    Thursday, December 23, 2010

    ECG Interpretation Review - #9 (Hemiblock, Axis, Ischemia vs Normal T Wave Inversion)

    QUESTION: Interpret the 12-lead ECG below, obtained from an older patient with atypical chest pain.
    • Is there a hemiblock?
    • Is there evidence of inferior ischemia?
    Figure 1 (ECG reproduced from ECG-2014-ePub )
    Note - Enlarge by clicking on Figures -


    INTERPRETATION:  The rhythm is fairly regular at 60-65/minute. The PR, QRS, and QT intervals are normal.
    • Axis - There clearly is LAD (Left Axis Deviation) - as determined by the positive QRS complex in lead I - and the predominantly negative QRS in lead aVF. This raises the question as to whether the axis is negative enough to qualify as "pathologic" LAD (which we define as an axis more negative than -30 degrees). To determine this - simply look at Lead II. We know in general that axis is perpendicular to (ie, 90 degrees away from) a lead where the QRS is isoelectric (ie, equal parts positive and negative).  IF lead II (which views the heart's electrical activity from +60 degrees) is more negative than positive - then the axis must be more than 90 degrees away from lead II, or more negative than -30 degrees. This degree of axis deviation qualifies as pathologic LAD (Figure 2).
    Figure 2 - Pathologic LAD as defined by Lead II appearance.
    (Reproduced from ECG-2014-ePub )
    Hemiblocks: A hemiblock is a defect in conduction along one of the two hemifascicles of the left bundle branch. Thus, there are only two types of hemiblock: LAHB (Left Anterior HemiBlock) and LPHB (Left Posterior HemiBlock). Consideration of the following greatly simplifies remembering how to identify the hemiblocks:
    • LAHB - is by far the most common type (~99%). Definitions as to what constitutes LAHB vary, even among experts.  Practically speaking - there is LAHB - IF there is pathologic axis deviation. Thus, Lead II holds the KEY for determining IF there is LAHB (which is present IF the net deflection in lead II is more negative than positive).
    • LPHB - is rare! The left posterior hemifascicle is much thicker than the anterior hemifascicle - and it has a dual blood supply (from the left and right coronary arteries).  LPHB is especially rare as an isolated defect when there is no associated RBBB.
    In Figure 1 - there clearly is LAHB based on the presence of a predominantly negative QRS in Lead II (Figures 2,3).
    Figure 3 - Blow-up of Figure 1 - showing pathologic LAD with a predominantly negative QRS in lead II.
    (Reproduced from ECG-2014-ePub ).
    Returning to Our Systematic Approach: 
    • Chamber Enlargement - None.
    • Q-R-S-T Changes:  - Tiny q waves are seen in leads I and aVL of Figure 1.  Transition is normal (occurring between V3-to-V5).  There is no ST segment elevation - but there is ST segment coving and shallow symmetric T wave inversion in lead III, with ST-T wave flattening in lead aVF.
    CLINICAL IMPRESSION: Normal sinus rhythm. LAHB. Small, septal q waves in leads I, aVL.  Shallow, symmetric T wave inversion in lead III and ST flattening in aVF - but there are probably no acute changes.  Suggest clinical correlation.
    • PEARL: Certain leads in an adult ECG may normally manifest either Q waves and/or T wave inversion.  These leads are III - aVF - aVL - aVR - and V1.  As suggested by the small green circles in Figure 4 - these leads appear to form a "reverse Z".
    Figure 4 - "Reverse Z" to remind which leads may normally show either Q waves and/or T wave inversion (Leads III,aVF,aVL,aVR,V1).
    (Reproduced from ECG-2014-ePub).
    Final Point: We cannot be certain from Figure 1 that symmetric T wave inversion in lead III does not represent ischemia.  However, the history (chest pain is atypical) and lack of abnormalities in other leads (apart from nonspecific ST flattening in aVF) make ischemia much less likely in this case.
    • Bottom Line: - Isolated T wave inversion or Q waves in leads III, aVF, or aVL may be a normal finding.
    -------------------------------------------

    Wednesday, December 22, 2010

    ECG Interpretation Review - #8 (Tachycardia, Acute Changes)


    QUESTION: Interpret the 12-lead ECG and accompanying Lead II rhythm strip.  These were obtained from a patient with new-onset dyspnea, but no chest pain.
    • What do you see in addition to the tachycardia?

    Figure 1 ECG obtained from a patient with new dyspnea


    INTERPRETATION:  Look first at the lead II rhythm strip. There is some baseline artifact and lead wander. The rhythm itself is rapid and irregularly irregular.  The QRS complex is narrow. There are undulations in the baseline — but no definite P waves are seen. This is Atrial Fibrillation with a rapid ventricular response. Regarding intervals — there are no P waves (ergo no PR interval). The QRS is of normal duration; the heart rate is too fast to assess the QT.  The mean QRS axis is normal and close to zero (almost a null QRS vector in lead aVF). There is no definite chamber enlargement (though we might suspect LVH from the relatively deep S waves in leads V1,V2).
    • Q-R-S-T Changes:  A large Q wave is seen in lead III; there may be a small q wave in lead II.  QS complexes are seen in leads V1 and V2, with a suggestion of smaller q waves in other precordial leads. Transition is slightly delayed and occurs between V4-to-V5.  There is ST elevation in lead III, with hyperacute T waves in this lead and in aVF. Moreover, there is marked ST coving and elevation across the precordial leads (with "frowny" configuration)
    • As suggested in Figure 2 — this is sometimes referred to as "tombstone" ST elevation because of its associated clinical implications (often a large infarct with correspondingly guarded prognosis).

    Figure 2 - Toombstone ("Frowny" ) ST Segment Elevation


    CLINICAL IMPRESSION:  In addition to rapid A Fib — We worry about acute extensive anterolateral (if not apical) MI in this patient without chest pain.
    • Up to 1/3 of all infarcts are "silent" MIs (ie, not associated with chest pain). Instead there may be dyspnea, mental status changes, GI symptoms, flu-like illness, or no symptoms at all (Of the non-chest-pain symptoms — acute dyspnea is by far the most common associated with acute MI ). Bottom Line: Always consider obtaining a 12-lead ECG in older patients who present with new-onset dyspnea. 
    -------------------------------------------------
    Final Point:  Note how QRS morphology changes in several leads (especially in leads III and V3). This could be due to aberrant conduction (which is common in atrial fibrillation when the rate is rapid) - or - it may be the result of movement artifact in this patient with acute shortness of breath.


    Tuesday, December 21, 2010

    ECG Interpretation Review - #7 (Infarction, ECG Changes, Inferior, Posterior, Lateral, Anterior MI)

     -------------------------------
    QUESTION: Interpret the 12-lead ECG below, obtained from a patient with new-onset severe chest pain.
    • How many abnormal findings can you identify?
    • What areas of the heart are involved?

    Figure 1 — ECG from a patient with new-onset chest pain (See text).


    INTERPRETATION:  The rhythm is sinus at 75/minute.  All intervals are normal.  We estimate the axis at +60 degrees.  There is no chamber enlargement.
    • Q-R-S-T Changes: There are fairly large Q waves in the inferior leads, and smaller q waves in V5,V6.  Transition occurs normally between leads V3-to-V4 (Did you notice slight loss of R wave fromV2 to V3? )
    • There is hyperacute ST segment elevation in leads III and aVF.  By the concept of "patterns-of-leads" (ie, simultaneously looking at all leads in a given lead group) — there is probably also some ST elevation in lead II.  There are reciprocal changes (ST depression/T wave inversion) in the anterolateral leads.
    CLINICAL IMPRESSION:  This ECG suggests acute inferior MI, with development of Q waves, ST elevation, and extensive reciprocal changes.  List #5 (Figure 2) suggests that in addition to reciprocal changes, the T wave inversion in leads V2,V3 could also be due to associated posterior MI and/or concomitant anterior ischemia (Note how the depressed ST segment pattern in leads I and aVL is virtually the mirror image of the ST elevation in leads III and aVF — ergo, true "reciprocal" changes!).

    Figure 2 - Causes of Anterior ST Depression with Inferior MI.


    ADDITIONAL POINTS:  Given the history (new-onset chest pain) and the ECG picture seen in Figure 1 - this patient is clearly a good potential candidate for acute intervention.
    • Finally — Subtle but real loss of R wave (from V2-to-V3) could be due to lead placement error or it could reflect loss of anterior forces from acute MI.
    --------------------------------------------------

    Monday, December 20, 2010

    ECG Interpretation Review - #6 (Chest Pain, Subtle ECG Changes)

     -------------------------------
    QUESTION: Interpret the 12-lead ECG below, obtained from a 45 year old man who presented to the ED with new-onset chest discomfort.  He had been previously healthy.  Risk factors include a history of smoking.  No prior ECG available.
    • How would you interpret his ECG?  - Any potentially worrisome ECG findings?
    • Clinically - What would you do?

    Figure 1: ECG from a 45-year old man with chest pain.


    INTERPRETATION:  The rhythm is sinus arrhythmia at a rate between 55-65/minute. All intervals (PR, QRS, QT) are normal.  The mean QRS axis is normal (about +80-85 degrees). There is no chamber enlargement.
    •  Q-R-S-T Changes:  - Small and narrow q waves are seen in a number of leads (II, III, aVF and V6) - and a deep Q wave (QS complex) is seen in lead aVL. Transition occurs normally (between leads V3-to-V4). T waves are somewhat peaked in several leads.  There is a hint of ST segment flattening (in leads II, III, aVF - as well as in lead aVL and V6).  There is isolated symmetric T wave inversion in lead aVL.
    CLINICAL IMPRESSION:  Sinus arrhythmia.  Small inferior q waves, and a QS in lead aVL of uncertain significance.  Small q in V6. Isolated symmetric T wave inversion in aVL.  T wave peaking, and subtle ST segment flattening in several leads.  These changes are probably not acute - but strongly suggest clinical correlation (See Comment below).


    ------------------------------------
    COMMENT: In view of the worrisome history (this 45-year-old man presents to the ED with new-onset chest discomfort) — there are 4 ECG findings that should at least be noted and addressed:
    1. Small and narrow q waves are seen in a number of leads. Small and narrow q waves are commonly seen as a normal finding in one or more of the lateral leads (I,aVL,V4,V5,V6). This reflects the process of septal activation, which normally moves from left-to-right.  Thus, the q wave in lead V6 is almost certainly a normal septal q wave.  There are also small and narrow inferior q waves (in leads II,III,aVF).  On occasion - inferior q waves may also be a normal finding IF seen in association with a relatively vertical QRS axis (as is the case here) and in the absence of other acute findings.
    2. In lead aVL - there is a deep Q wave (QS complex) and shallow but symmetric T wave inversion.  However, as an isolated finding - neither the deep Q wave nor the symmetric T inversion are necessarily abnormal in this lead (See Figure 4 in ECG Review #9).
    3. T waves are peaked in several leads in Figure 1 (in leads II,III,aVF,V4,V5,V6).  Although some T wave peaking may be a normal finding - this should be noted. The presence of T wave peaking always brings up the possibility of hyperkalemia as a cause - although there is nothing else in the clinical scenario given here to suggest hyperkalemia (no mention of renal disease, acidosis, or potassium-retaining drugs).  T wave peaking may also be due to ischemia on occasion (which could be relevant given the history of chest discomfort in this patient . . . ).
    4. There is subtle but real flattening of the ST segment in several leads in Figure 1 (leads II,III,aVF,aVL,V6).
    BOTTOM Line:  The history in this case is worrisome (a 45-year-old man who presents to the ED with new-onset chest discomfort) - and - a number of findings have been noted in our Descriptive Analysis of his initial ECG (above).  That said - we suspect that nothing acute is going on because the changes that are noted are subtle and not necessarily outside the range of normal.  That said - we can not tell for sure that nothing acute is going on based on this single tracing.
    • The clinical reality is that you will often not be able to tell for sure if acute infarction is occurring from assessment of a single ECG.
    • Clinically - A worrisome history by itself is more than enough to justify admission to the hospital to rule out acute infarction.  In the absence of a prior ECG for comparison - we would definitely admit this patient with chest discomfort to the hospital.  Even IF we had a prior ECG that looked identical to this one - IF the history was of concern, that alone would justify admission to the hospital.
    ------------------------------------

    Sunday, December 19, 2010

    ECG Blog #5 — TWI: Juvenile T Wave Variant?

     
    QUESTION: Interpret the 12-lead ECG below.
    • Clinically  How would you interpret the anterior T wave inversion (arrows) if this ECG was obtained from a middle-aged adult with chest pain?  Are these changes likely to be acute?
    • How would you interpret this same ECG if instead it was obtained from a healthy 5 year-old?

    Figure 1: The initial ECG in today's case (See text).


    INTERPRETATION:  The rhythm is sinus arrhythmia at a rate between 60-70/minute. All intervals (PR, QRS, QT) are normal.  There is RAD (Right Axis Deviation) with a mean QRS axis of about +100 degrees. There is no chamber enlargement.
    • Q-R-S-T Changes: There are small Q waves in the inferolateral leads. R wave progression is normal (with transition occurring between leads V3-to-V4).  Assessment of ST-T wave changes reveals deep symmetric T wave inversion in the anterior precordial leads (arrows in V1,V2,V3).

    CLINICAL IMPRESSION:  It depends !!!


    ------------------------------------
    COMMENT: Symmetric T wave inversion will often be seen in the anterior leads (V1,V2,V3 and even up to V4) of pediatric patients.  In an otherwise healthy child (with no heart murmur this finding represents a benign normal variant (referred to as a "Juvenile" T Wave Pattern).  However, the same ECG (with identical T wave inversion) would have to be interpreted very differently IF the patient in question was an older adult with chest pain (in which case ischemia would be suggested).
    • PEARL: Shape of the ST-T wave segment often provides an important clue to clinical significance (Figure 2). Thus, in an older adult with chest discomfort  symmetric T wave inversion (as highlighted by arrows in Figure 1 ) suggests ischemia
    • In contrast  asymmetric ST depression (left panel in Figure 2 ) is much more suggestive of "strain" that accompanies LVH.

    Figure 2: T Wave Morphology — 'Strain" vs Ischemia.


    BOTTOM Line:  Interpretation of the ECG shown in Figure 1 can not be done without provision of at least a brief clinical scenario.
    • Scenario #1 (the patient is a healthy 5-year-old with no heart murmur in which case sinus arrhythmia, RAD of this degree, and symmetric T wave inversion in leads V1,V2,V3 are all within the range of normal for the age of the child.
    • Scenario #2 (the patient is a middle-aged adult with chest pain in which case one has to be concerned about the possibility of ischemia.  More history and comparison with prior tracings would be needed to determine if these changes are likely to be acute.


    ------------------------------------
    NOTE The Descriptive Analysis for our interpretation is the same in both clinical scenarios (ie, "sinus arrhythmia, RAD, symmetric T wave inversion in V1-to-V3" )  but our Clinical Impression will be very different depending on whether the patient is a healthy child or an adult with chest pain!
    • P.S.: The ECG in Figure 1 might yet be interpreted differently if we had but another setting (ie, ongoing shortness of breath of uncertain etiology). In this instance  one would have to consider pulmonary embolism (despite the relatively slow heart rate) in view of: i) RAD; plus ii) Anterior symmetric T wave inversion, which could be a manifestation of acute right heart "strain" (sometimes seen with acute PE).
    ========================================== 


    NOTE:  For more on PJTWP (Persistent Juvenile T Wave Pattern) — including distinction between PJTWP vs other potentially serious conditions:
    • Please check out the Steve Smith ECG Blog post on PJTWP by Brooks Walsh/Steve Smith/Ken Grauer (Jan. 7, 2015). 

    ==========================================