
-------------------------------
QUESTION: Interpret the 12-lead ECG below, obtained from a 45 year old man who presented to the ED with new-onset chest discomfort. He had been previously healthy. Risk factors include a history of smoking. No prior ECG available.
- How would you interpret his ECG? - Any potentially worrisome ECG findings?
- Clinically - What would you do?
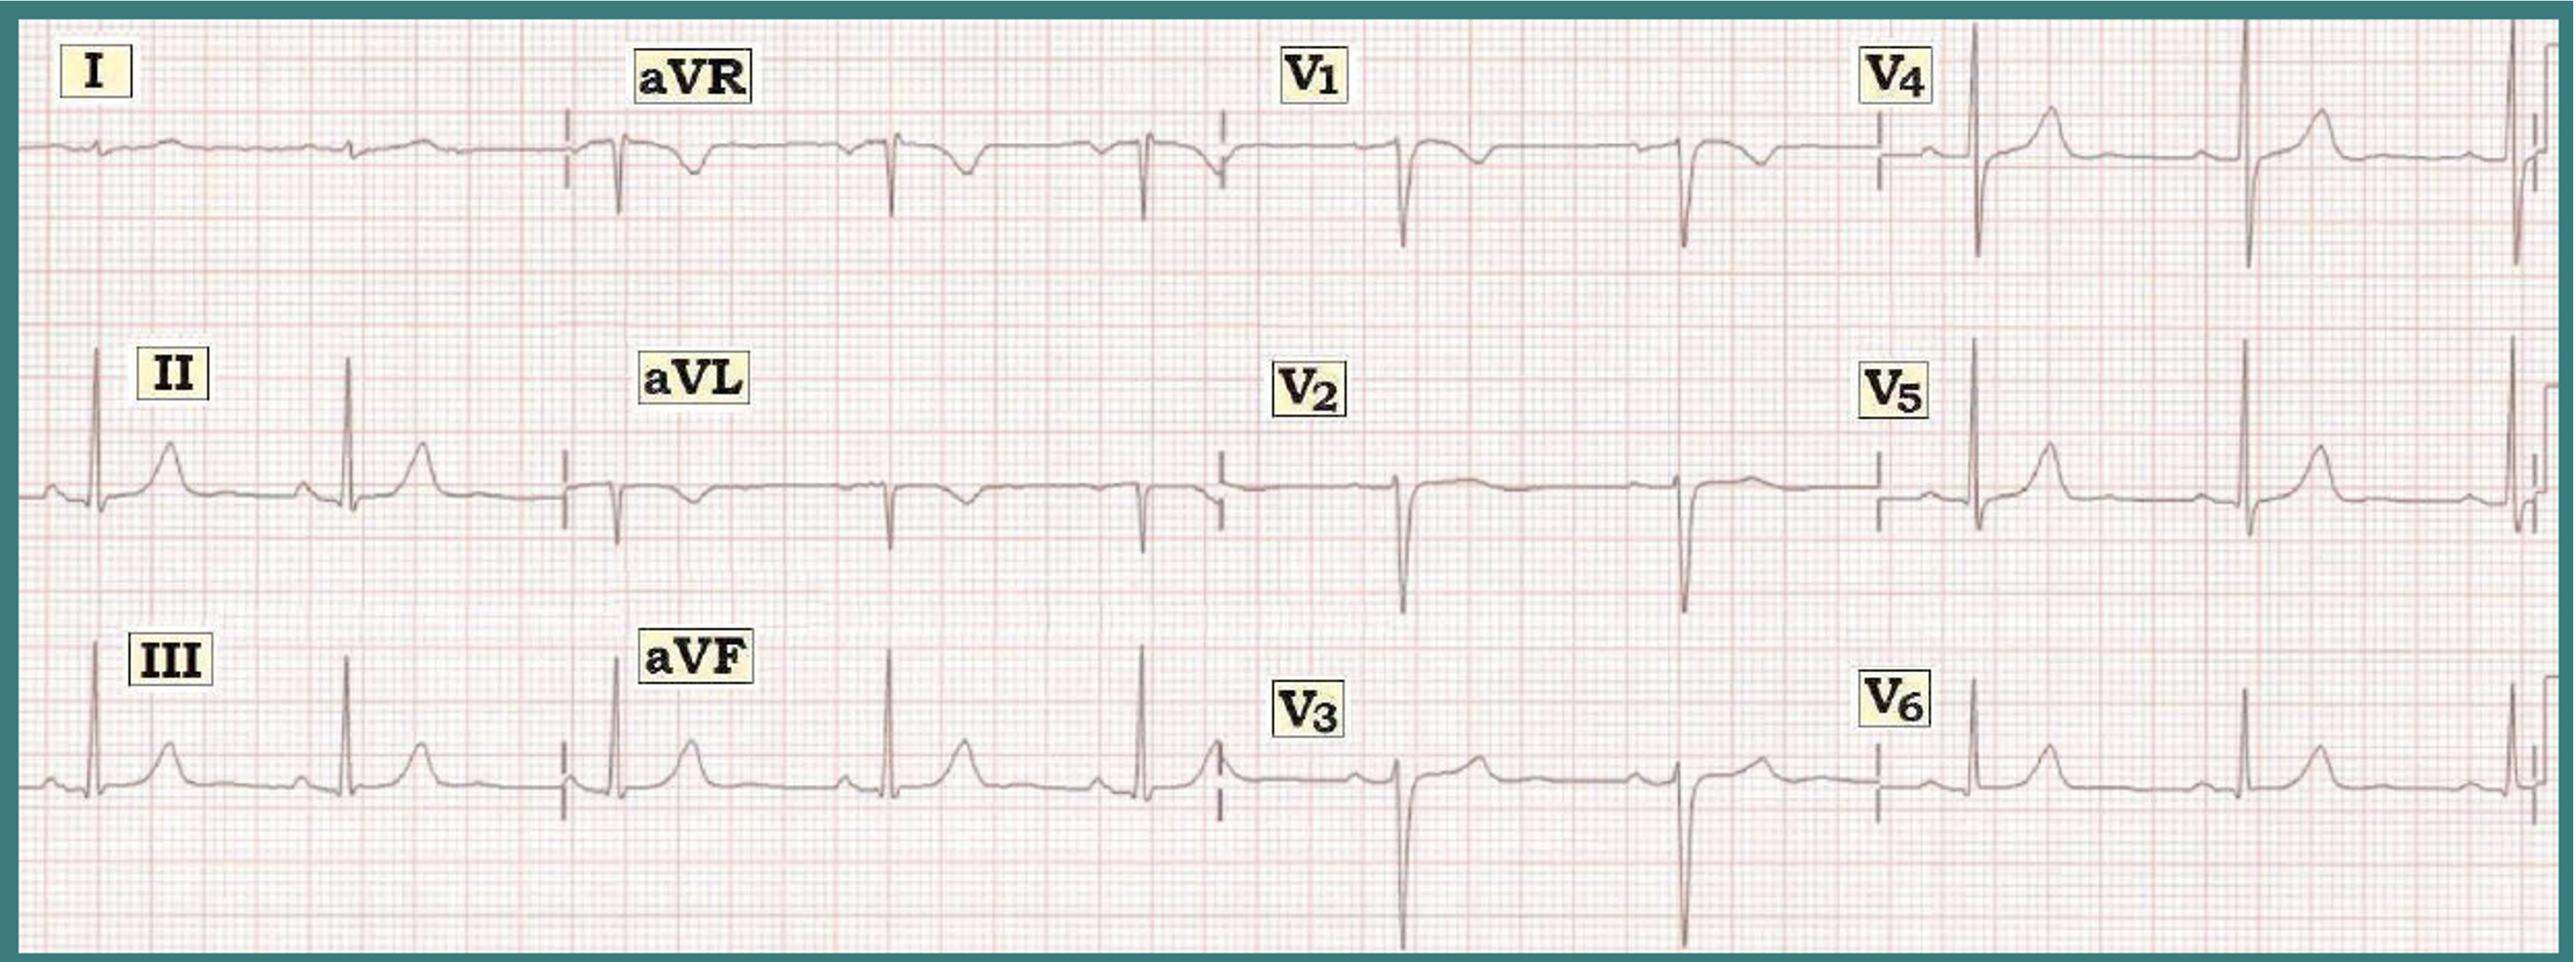 |
| Figure 1: ECG from a 45-year old man with chest pain. |
INTERPRETATION: The rhythm is sinus arrhythmia at a rate between 55-65/minute. All intervals (PR, QRS, QT) are normal. The mean QRS axis is normal (about +80-85 degrees). There is no chamber enlargement.
- Q-R-S-T Changes: - Small and narrow q waves are seen in a number of leads (II, III, aVF and V6) - and a deep Q wave (QS complex) is seen in lead aVL. Transition occurs normally (between leads V3-to-V4). T waves are somewhat peaked in several leads. There is a hint of ST segment flattening (in leads II, III, aVF - as well as in lead aVL and V6). There is isolated symmetric T wave inversion in lead aVL.
CLINICAL IMPRESSION: Sinus arrhythmia. Small inferior q waves, and a QS in lead aVL of uncertain significance. Small q in V6. Isolated symmetric T wave inversion in aVL. T wave peaking, and subtle ST segment flattening in several leads. These changes are probably not acute - but strongly suggest clinical correlation (See Comment below).
------------------------------------
COMMENT: In view of the worrisome history (this 45-year-old man presents to the ED with new-onset chest discomfort) — there are 4 ECG findings that should at least be noted and addressed:
- Small and narrow q waves are seen in a number of leads. Small and narrow q waves are commonly seen as a normal finding in one or more of the lateral leads (I,aVL,V4,V5,V6). This reflects the process of septal activation, which normally moves from left-to-right. Thus, the q wave in lead V6 is almost certainly a normal septal q wave. There are also small and narrow inferior q waves (in leads II,III,aVF). On occasion - inferior q waves may also be a normal finding IF seen in association with a relatively vertical QRS axis (as is the case here) and in the absence of other acute findings.
- In lead aVL - there is a deep Q wave (QS complex) and shallow but symmetric T wave inversion. However, as an isolated finding - neither the deep Q wave nor the symmetric T inversion are necessarily abnormal in this lead (See Figure 4 in ECG Review #9).
- T waves are peaked in several leads in Figure 1 (in leads II,III,aVF,V4,V5,V6). Although some T wave peaking may be a normal finding - this should be noted. The presence of T wave peaking always brings up the possibility of hyperkalemia as a cause - although there is nothing else in the clinical scenario given here to suggest hyperkalemia (no mention of renal disease, acidosis, or potassium-retaining drugs). T wave peaking may also be due to ischemia on occasion (which could be relevant given the history of chest discomfort in this patient . . . ).
- There is subtle but real flattening of the ST segment in several leads in Figure 1 (leads II,III,aVF,aVL,V6).
BOTTOM Line: The history in this case is worrisome (a 45-year-old man who presents to the ED with new-onset chest discomfort) - and - a number of findings have been noted in our Descriptive Analysis of his initial ECG (above). That said - we suspect that nothing acute is going on because the changes that are noted are subtle and not necessarily outside the range of normal. That said - we can not tell for sure that nothing acute is going on based on this single tracing.
- The clinical reality is that you will often not be able to tell for sure if acute infarction is occurring from assessment of a single ECG.
- Clinically - A worrisome history by itself is more than enough to justify admission to the hospital to rule out acute infarction. In the absence of a prior ECG for comparison - we would definitely admit this patient with chest discomfort to the hospital. Even IF we had a prior ECG that looked identical to this one - IF the history was of concern, that alone would justify admission to the hospital.
------------------------------------
What is the significance of ST segment flattening? I understand it must be clinically coordinated, but theoretically what could this imply?
ReplyDeleteGood question Andrew. There are many potential causes of ST-T wave flattening. To me - the principal significance of recognizing that ST-T waves in leads like II,III,aVF and V6 in this tracing are distinctly straight with abrupt transition from ST segment-to-T wave - is that it tells me the ST segments are not "normal". Coronary disease (ischemia) may clearly cause such flattening. Other factors (drugs, electrolyte disturbance, hyperventilation, etc.) may also cause such flattening - however the ST-T wave straightening that we see here occurs in the context of a previously healthy 45 yo who presents with new-onset chest discomfort. In this context - ischemia/coronary disease move to the forefront of conditions that should be excluded.
ReplyDeleteHello sir...
ReplyDeleteWhat about Lead 1... The T wave looks hyperacute T wave when compared to its QRS...
Was there any follow up on this case???
Thank you
@ MG — Thank you for your comment! The difficulty in assessing the ST-T wave in lead I is how tiny the overall complex in this lead is. I don't think there is enough to call the picture we see in lead I as "hyperacute changes" — but the Bottom Line (as I emphasize above) is that we cannot know this for certain from this single ECG, and that regardless of how one interpret's ST-T wave changes in lead I, that close follow-up is indicated in this patient with new symptoms. This would include an Echo (which can be diagnostic if a wall motion abnormality is seen during symptoms), follow-up tracings, and troponins (since this patient is presenting to the ED with this tracing). Unfortunately — I do not have follow-up on this case.
ReplyDeleteAlthough the RS transition is normal but from v1 to v3 the R wave height is not quite what we would expect in a 45yr old male... Can this be a benign finding in otherwise asymptomatic pts?
ReplyDeleteCan this be a sign of anterior wall involvement in this case with chest pain 45yr old male?
There are definite small r waves present in V1,2,3 — and there is normal R wave height in lead V4. Yes, it is true that one may lose r wave amplitude with anterior infarction — and it is good to note that the r waves are small here — but this finding in the absence of clear acute changes in not specific ... A more common cause of small R waves is lead misplacement. Hard to know what is going on here because this patient is having chest pain and the ST-T segments while not suggesting acute change are also not completely normal ...
DeleteHi Dr. Grauer, great blog. I am just wondering this ecg is suggestive of an emphysema in this man - of course after ruling out ACS. Small qrs complex in lead 1, negative qrs in AvL, poor r wave progression all could point to emphysema?
ReplyDeleteLeo Schamroth many years suggested the finding of a null vector (or almost null vector) for the QRS and ST-T wave in lead I (ie, TINY amplitude in lead I) — was a strong suggestive hint of significant pulmonary disease. This is not a common finding — but I completely agree that it CAN be quite helpful when seen. That said — this finding can be seen in slender individuals or those with a “vertical heart” not necessarily associated with severe pulmonary disease. I really don’t see other signs of RVH on this tracing (no RAA, no RV “strain”, no persistent deep S waves in lateral chest leads; and transition IS between V3-to-V4, so really not "poor R wave progression") — so while I’d consider the possibility of pulmonary disease — I probably would not call it in this patient given the above — :)
DeleteWhy lead I look lik this small complex?
ReplyDeleteThe reason the QRS in lead I is so tiny — is that the frontal plane axis is approximately +90 degrees. Note how much taller leads II and III are than lead I. So the main "vector" of electrical activity is between leads II and III (and oriented at approximately +90 degrees). Since lead I is the limb lead that is furthest away from this, it is tiny.
Delete