Friday, July 23, 2021

ECG Blog #244 (58) — The Cath Lab Was Activated. Do You Agree?


==============================

Please NOTE: There will be no new ECG Blog posts for a while ...


All material on this ECG Blog site remains open!

  • The INDEX tab in the upper right of each page has linked Contents, listed by subject.
  • IF you scroll down a little on the right-hand column of this blog — You'll see an icon for "ECG Audio PEARLS". This link takes you to 45 Audio Pearls, all of which are recent — and organized by topic.
  • Just below the Audio Pearls — is an icon for "ECG Video PEARLS". Each of my recent 16 Video Pearls is downloaded onto this page for easy reference — again, organized by topic.
  • If you are looking for material to review — I suggest you consider my most recent blog posts — which are linked to each of the Audio and Video Pearls.

Look for these icons for my Audio and Video PEARLS (scrolling down a bit in the right-hand column of each page).


THANK YOU all for your interest & support!
— I'll be back! —


==============================

ECG Blog #244 (MP-58) — The Cath Lab Was Activated. Agree?

==============================


The ECG in Figure-1 was obtained from a non-English speaking adult male, who presented with acute abdominal pain. The patient had a known history of diabetes — but because of the language barrier, the history was otherwise extremely limited.

  • On seeing the ECG in Figure-1 — the cath lab was activated.


QUESTION:

  • Should the cath lab have been activated?
  • Explain your answer.


Figure-1: ECG obtained from a non-English speaking adult man with a history of diabetes and acute abdominal pain. The cath lab was activated. Do you agree?


=======================================

NOTE: Some readers may prefer at this point to listen to the 8:30-minute ECG Audio PEARL before reading My Thoughts regarding the ECG in Figure-1. Feel free at any time to refer to My Thoughts on this tracing (that appear below ECG MP-58).

=======================================


Today's ECG Media PEARL #58 (8:30 minutes Audio) — Reviews some lesser-known Pearls for ECG recognition of Hyperkalemia.


MY Sequential Thoughts on the ECG in Figure-1:

As much as I "preach" the need to be systematic in ECG interpretation (as reviewed in detail in ECG Blog #205) — my "eye" was instantly drawn to several KEY findings for the ECG shown in Figure-1. This immediately suggested 2 ECG diagnoses to me.


QUESTION:

  • What are the 2 ECG diagnoses that should come to mind within seconds of seeing the ECG in Figure-1?


ANSWER:

  • A Brugada-1 ECG pattern is seen.
  • Significant hyperkalemia is probably present.


PEARL #1: As important as a systematic approach to ECG interpretation is — the experienced clinician will with some ECGs immediately (almost automaticallyknow within seconds what is going on. When you encounter this — LISTEN to what the ECG is telling you. Sometimes this instinctive (almost automatic) diagnosis that you instantly "just know" may require immediate treatment (as when you see a wide tachycardia and know from the ECG appearance that the rhythm is VT). Therefore — Allow yourself a quick 5-10 seconds to "take in" any diagnosis that just "comes" to youThen go back to the ECG — and complete your systematic interpretation.

  • In Figure-1 — the importance of rapidly recognizing the Brugada-1 ECG pattern with probable severe Hyperkalemia is that: i) Immediate treatment of the hyperkalemia is needed; and, ii) Both of these conditions may dramatically alter ECG appearance in a way that will hinder systematic assessment if you don't realize these conditions are present. This happened in today's case — as initial providers mininterpreted the ECG in Figure-1 as suggestive of an acute STEMI, and therefore activated the cath lab.


The Brugada-1 ECG Pattern:

As illustrated and discussed in detail in ECG Blog #238 — the shape of the extreme (almost 10 mm) coved ST elevation in leads V1V2 and V3, that terminates in T wave inversion is diagnostic of a Brugada-1 ECG pattern. This is especially true for the picture we see for the QRST complex in lead V1.

  • This image of the QRST complex in lead V1 should be "engrained" in our brains — as a visual sign that immediately says, "I'm a Brugada-1 ECG pattern".
  • While understandable that the overwhelming amount of ST elevation in anterior leads V1, V2 and V3 might prompt concern for a large anterior STEMI — the 2nd ECG diagnosis that our "experienced eye" has already made ( = hyperkalemia) — makes it much less likely that there would also be an ongoing STEMI.
  • P.S. One might also misinterpret the rSR' in lead V1, with wide terminal S waves in leads I and V6 as consistent with RBBB. While true that this QRS morphology is consistent with RBBB — simple RBBB does not produce the ST segment shape that we see in each of the first 3 anterior leads, in which the dramatically elevated ST segments are coved (in V1,V2) and voluminous, taking a very delayed path in their descent toward final T wave inversion. NOTE: While I can not rule out the possibility that there is also underlying RBBB from this single tracing — what we know is that there is a Brugada-1 ECG pattern!


PEARL #2: As emphasized in ECG Blog #238 — a number of conditions other than Brugada Syndrome may temporarily produce a Brugada-1 ECG pattern. Among these other conditions — Hyperkalemia is perhaps the most common.

  • Development of a Brugada-1 or Brugada-2 ECG pattern as a result of some other condition — with resolution of this Brugada ECG pattern after correction of the precipitating factor(s) is known as Brugada Phenocopy. The importance of recognizing Brugada Phenocopy — is that the risk of malignant arrhythmias is far less than it is for Brugada Syndrome.
  • Regardless of whether one was still concerned that the ST elevation in Figure-1 might also represent an ongoing STEMI — Severe hyperkalemia would need to be treated before acute cath (and before any potential intervention for acute MI) could be contemplated. Therefore — the initial management approach to this patient is essentially defined within the few seconds it should take to recognize the severe hyperkalemia and Brugada-1 pattern on ECG (ie, promptly beginning with IV Calcium, even before lab confirmation returns).
  • Whether the ECG changes in Figure-1 represent Brugada Phenocopy or Brugada Syndrome — and/or a STEMI — is almost certain to become apparent with ongoing monitoring of the serum K+ level — treatment of any other predisposing conditions — and through serial ECGs, that should show marked improvement, with resolution of ST elevation as serum K+ is corrected IF the ECG changes in Figure-1 are the result of Brugada Phenocopy.


The 2nd ECG Diagnosis = Severe HyperKalemia:

For clarity — I've added Figure-2, which presents the "textbook" sequence of ECG findings seen with progressive degrees of hyperkalemia. While fully acknowledging that "not all patients read the textbook" — and that there will be variations in the various ECG findings from one patient-to-the-next — I have found awareness of the generalizations for these ECG signs in Figure-2 to be extremely helpful.

  • The usual earliest sign of hyperkalemia ( = T wave peaking) may begin with no more than minimal K+ elevation (ie, K+ between 5.5-6.0 mEq/L) — although in some patients, T wave peaking won't be seen until much later.
  • I love the image of the Eiffel Tower. With progressive degrees of hyperkalemia — the T wave becomes tall, peaked (pointed) with a narrow base. While patients with repolarization variants or acute ischemia (including the deWinter T wave pattern) often manifest peaked T waves — the T waves with ischemia or repolarization variants tend not to be as pointed as is seen with hyperkalemia — and, the base of those T waves tends not to be as narrow as occurs with hyperkalemia.
  • P.S. As helpful as I find Figure-2 is for providing insight to the ECG changes we look for when suspecting clinically significant hyperkalemia — progression from sinus rhythm to VFib as the 1st ECG sign of hyperkalemia has been documented. Not all patients read the textbook. (emDocs, 2017 — Management of Hyperkalemia).


Figure-2: The "textbook" sequence of ECG findings with hyperkalemia.


ECG Changes of Hyperkalemia in Today's Case:

The reasons I instantly suspected severe hyperkalemia in today's case were:

  • Significant QRS widening (to at least 0.11 second in leads I, II, aVL and others).
  • T wave morphology that is typical for hyperkalemia. As shown in Figure-3 — the T waves in multiple leads resemble the Eiffel Tower (ie, not only are the T waves in leads I, II, aVL; V4, V5 and V6 tall, peaked and pointed — but these T waves are symmetric with an equally steep angle of rise and fall — with a narrow T wave base).
  • There is a Brugada-1 ECG pattern in leads V1, V2 and V3. As emphasized above — it is common to see Brugada Phenocopy in association with severe hyperkalemia.


Beyond-the-Core: Did YOU notice the "hump" in lead V3 (BLUE arrow). I believe what we are seeing in this lead is the pointed peak of what the T wave in lead V3 would have looked like — were it not obscured by the Brugada-1 pattern.


Figure-3: Take another look at the ECG in today's case. Don't YOU See the Eiffel Tower effect for the T waves in multiple leads?


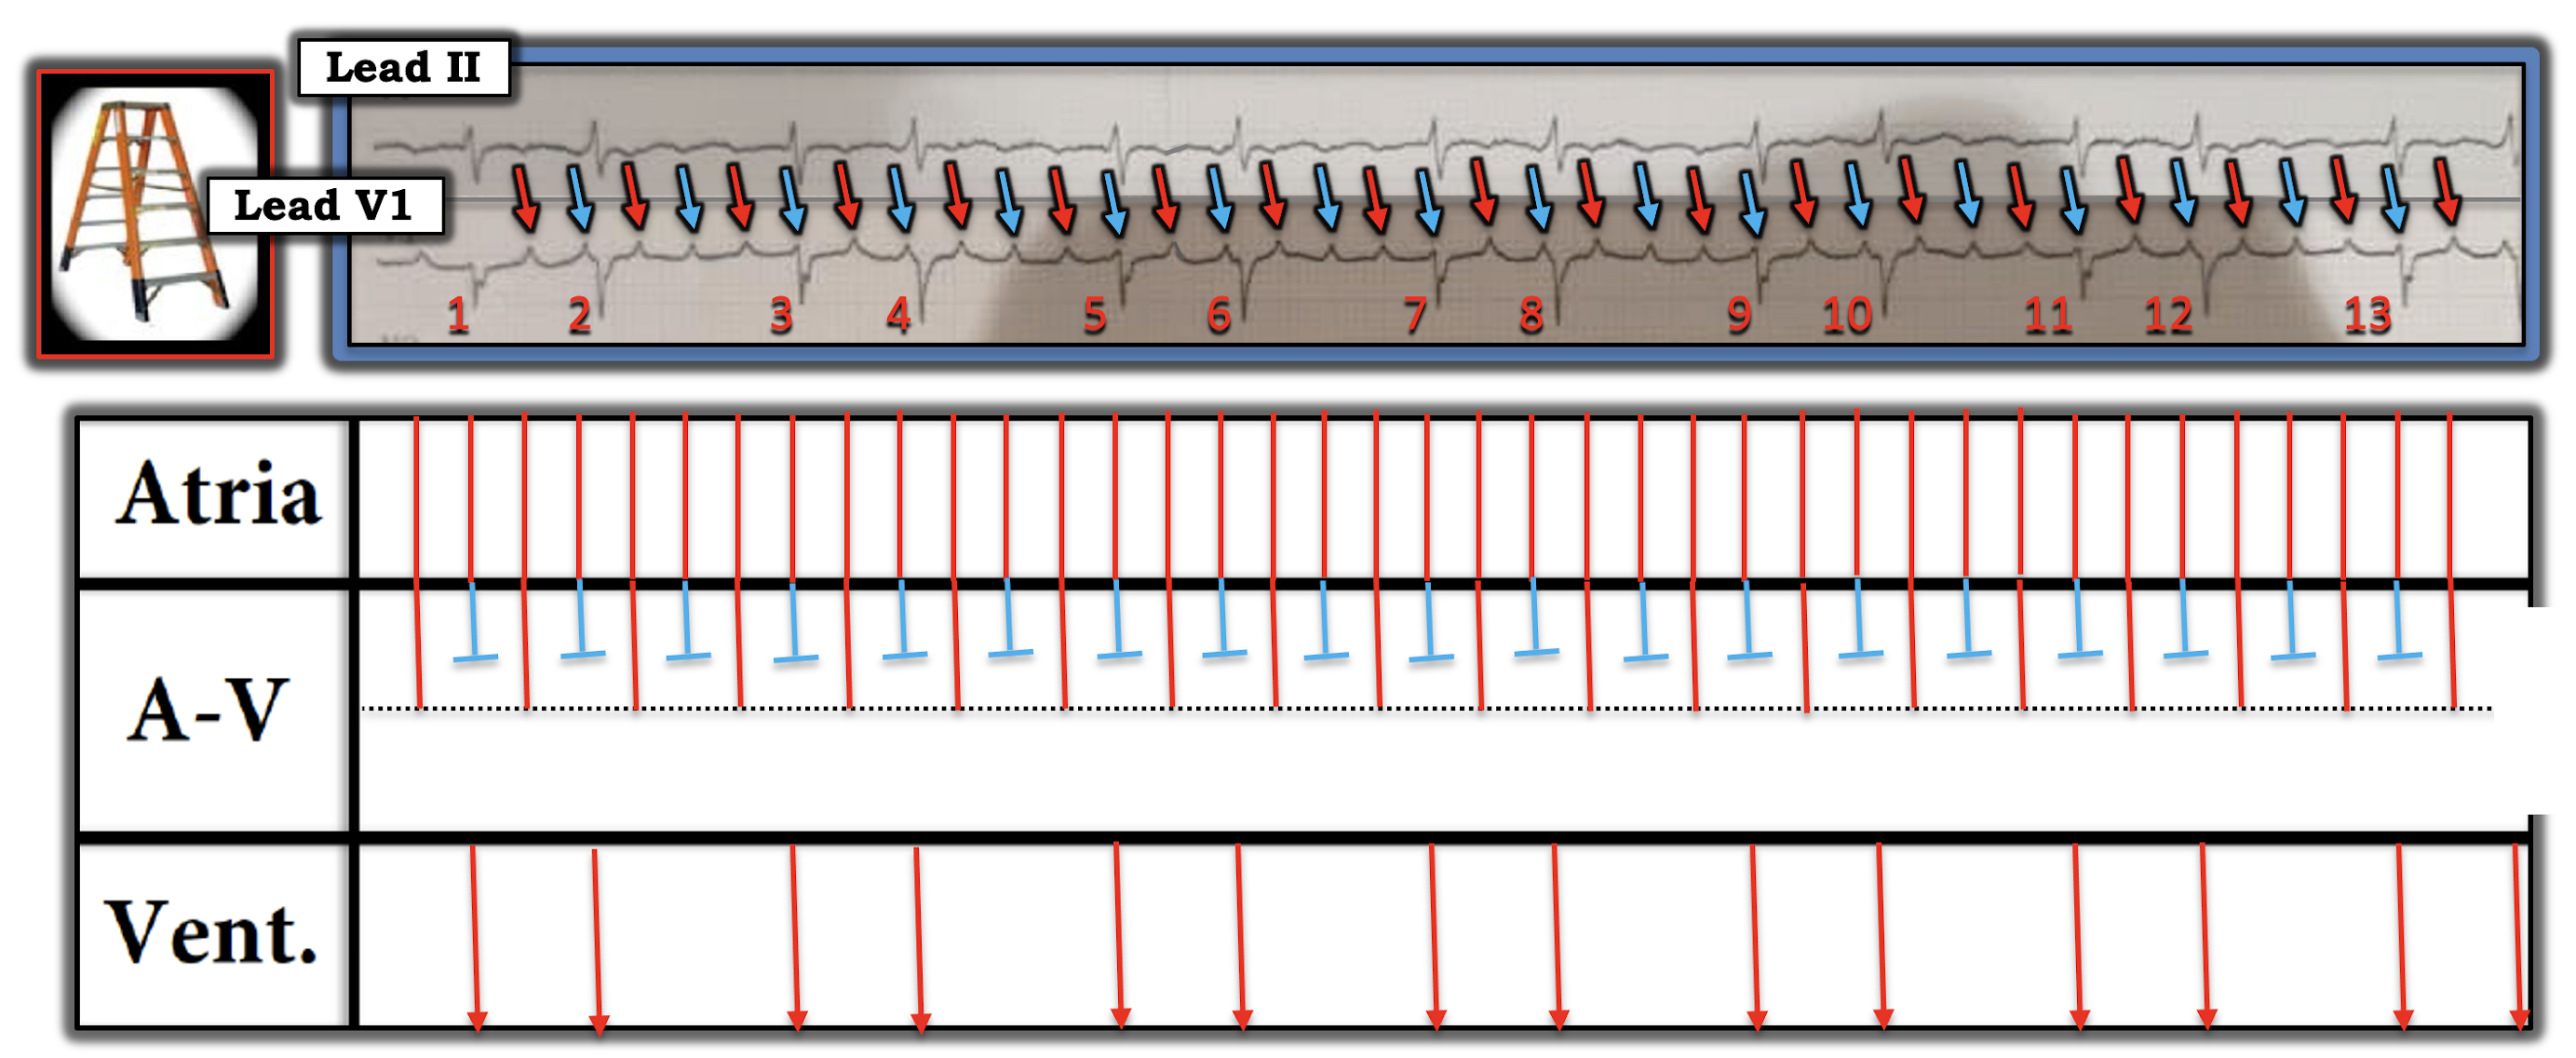
PEARL #3: Assessment of the rhythm with severe hyperkalemia is often extremely difficult because: i) As serum K+ goes up — P wave amplitude decreases, and eventually P waves disappear (See Panels D and E in Figure-2)ii) As serum K+ goes up — the QRS widensandiii) In addition to bradycardia — any form of AV block may develop, and AV conduction disturbances with severe hyperkalemia often do not "obey the rules" (See Figure-4).

  • THINK for a MOMENT what the ECG will look like IF you can't clearly see P waves (or can't see P waves at all) — and the QRS is wide? ANSWER: The ECG will look like there is a ventricular escape rhythmor like the rhythm is VT if the heart rate is faster.
  • NOTE: We do not see P waves in most of the leads in Figure-3 — and it's difficult to be certain if the deflection in lead II is a sinus P wave (RED arrow). Fortunately — a definite P wave is seen in lead aVF, which confirms that the rhythm is still sinus (ie, sinus tachycardia at ~135/minute). But without lead aVF — I would not have been at all certain what the rhythm was.


Figure-4: Why assessing the rhythm with hyperkalemia is difficult (See text).


Follow-Up to the Case:

The cardiac cath was negative (Clean coronary arteries! ). That said — the patient's condition precipitously declined after catheterization — and he was emergently intubated. Pertinent lab findings on admission included a pH = 6.94 — glucose over 1,100 mg/dL — serum K+ = 7.5 mEq/L.

  • Fortunately — the patient's DKA (Diabetic KetoAcidosis) responded to treatment, with normalization of lab values.
  • I was unable to obtain follow-up ECGs that could have confirmed my suspicion of Brugada Phenocopy.


==================================

Acknowledgment: My appreciation to David Didlake (from Texas, USA) for allowing me to use this case and these tracings.

==================================


Related ECG Blog Posts to Today’s Case: 

  • ECG Blog #205 — Reviews my Systematic Approach to 12-lead ECG Interpretation. 
  • ECG Blog #238 — Reviews Brugada Syndrome vs Brugada Phenocopy. 

  • The January 26, 2020 post in Dr. Smith's ECG Blog — Reviews a number of examples of hyperkalemia (with My Comment at the bottom of the page). 
  • The September 5, 2020 post in Dr. Smith's ECG Blog — Reviews another case of Brugada Phenocopy from Hyperkalemia (with My Comment at the bottom of the page). 
  • The April 25, 2020 post in Dr. Smith's ECG Blog — One more case Brugada Phenocopy from Hyperkalemia + "Shark Fin"-like ST Elevation (with My Comment at the bottom of the page). 
  • The October 21, 2020 post in Dr. Smith's ECG Blog — Reviews a case of Hyperkalemia which highlights the difficulty of determining the Rhythm (with My Comment at the bottom of the page).


Monday, July 19, 2021

ECG Blog #243 (47) — Why the Group Beating? (AV Block?)


Today's case is about the interpretation of the 2-lead rhythm strip that is shown in Figure-1. There is no clinical information.

  • WHY is there group beating?
  • Is there AV block? 


Figure-1: How would you interpret this 2-lead rhythm strip? (NOTE: Since the ECG grid is faded — I have drawn in the size of 2 large boxes in between beats #4-5).


=======================================

NOTE: Some readers may prefer at this point to listen to the 5:45 minute ECG Audio PEARL before reading My Thoughts regarding the ECG in Figure-1. Feel free at any time to review to My Thoughts on this tracing (that appear below ECG MP-47).

=======================================


Today’s ECG Media PEARL #47 (5:45 minutes Audio) — Reviews the concept of a Bigeminal Rhythm (which may be due to Atrial or Ventricular Bigeminy, Wenckebach conduction — or other causes).

  • NOTE: Today's Audio Pearl was previously published in ECG Blog #232 — but I am again including it here, as it is optimally relevant for today's post.


MSequential APPROACH to this CASE:

The QRS complex appears to be narrow in both of the monitoring leads shown. Assuming that other leads confirmed this impression — this means that the rhythm in Figure-1 is supraventricular!

  • The most remarkable finding in this tracing is that there is group beating in the form of a bigeminal rhythm — with alternating long-short cycles.


===============================

PEARL #1: The Differential Diagnosis of a Bigeminal Rhythm is limited. It includes the following entities:

  • Sinus rhythm with atrial or junctional bigeminy (ie, every-other-beat is a PAC or a PJC).
  • Ventricular bigeminy (ie, every-other-beat is a PVC).
  • SA ( = Sino-Atrial) Block.
  • Mobitz I, 2nd-Degree AV Block ( = AV Wenckebach) with 3:2 AV conduction.
  • Mobitz II, 2nd-Degree AV Block.
  • Atrial fibrillation, atrial tachycardia or atrial flutter with Wenckebach conduction.
  • "Escape-Capture" Bigeminy (the 1st beat in each group is a junctional or ventricular escape beat — followed by a conducted beat).

=============================== 

SUGGESTION: I find it helpful whenever I encounter a bigeminal rhythm to keep the above possibilities in mind as I assess the rhythm!

===============================


Continuing with My Sequential Thought Process:

Regarding P Waves in Figure-1 — There is definite atrial activity, which is seen best in lead V1. At this point, as I often suggest — the simple act of labeling P waves greatly facilitates assessment of the possible relationship between atrial activity and neighboring QRS complexes (RED arrows in Figure-2).

  • RED arrows in Figure-2 indicate that atrial activity is regular. Judging by the size of the 2 large boxes that I drew in (between beats #4-5) — the atrial rate is ~250/minute.
  • As expanded upon in ECG Blog #229 — the gentle "sawtooth" pattern in lead II, in association with rapidity of the atrial rate makes it more likely that the underlying rhythm is AFlutter (rather than ATach). Technically then — the RED arrows in Figure-2 highlight "flutter waves" rather than "P waves". 


Figure-2: I've labeled P waves (flutter waves) with RED arrows in the long lead V1 rhythm strip.


QUESTION: Are any of the flutter waves that we see in Figure-2 being conducted to the ventricles?

  • HINT: Are there any PR intervals that repeat?


ANSWER: There are several clues that tell us that at least some of the flutter waves in Figure-2 are being conducted to the ventricles. These include the fact that:

  • Group beating is present — in which the duration of each of the short R-R intervals is constant — and duration of each of the longer R-R intervals is also constant. This is not to say that conduction is not possible when group beating is not as consistent as it is in Figure-2 — but rather to emphasize that seeing how precise duration of alternating short-long R-R intervals is, tells us that there is a definite fixed ratio of flutter wave conduction!
  • There are 2 sets of repetitive PR intervals in Figure-2. To facilitate recognizing this — I have selected different colors for each of the flutter waves in Figure-3


PEARL #2 — To Facilitate Understanding What We Are Looking For in Figure-3:

  • Because of their rapid atrial rate — both AFlutter and ATach often manifest Wenckebach conduction. We can immediately suspect the presence of Wenckebach conduction out of the AV node with either AFlutter or ATach whenever we see group beating (as we do in Figure-3).
  • When the groups of beats with AFlutter manifest a bigeminal pattern (as they do in Figure-3) — there will usually be a dual-level of block as flutter waves exit from the AV node. In such cases — the ratio for conduction of flutter waves in the upper AV nodal level is often 2:1
  • When the atrial rate is rapid (as it is with both AFlutter and ATach) — P waves (or flutter waves) that are close to the next QRS complex will usually not be able to conduct. This is because of the phenomenon known as "concealed" conduction — in which the very rapid rate of atrial impulses arriving at the AV node "overwhelms" the ability of the AV node to conduct each of these atrial impulses normally. This leads to a "delay" in conduction time that we do not directly see on the ECG (therefore use of the term "concealed" conduction).
  • In Figure-3 — WHITE arrows highlight atrial activity with too short of a PR interval to conduct. Atrial activity highlighted by BLUE arrows definitely can not conduct — as it occurs simultaneous with the QRS complex, at which time the ventricles are refractory. This leaves us with the presumption that RED arrows that precede each of the short R-R intervals must be conducting ( = the RED arrows seen before beats #2, 4, 6, 8, 10 and 12).
  • Since the AV conduction ratio in the upper AV nodal level is often 2:1 — this presupposes that alternate flutter waves are probably conducting ( = the RED arrows seen just after beats #2, 4, 6, 6, 8, 10 and 12). IF this is indeed the case — then the flutter waves highlighted by the PINK arrows would not make it through the upper AV nodal level.
  • Bottom Line regarding Figure-3: I suspected that only those flutter waves highlighted by RED arrows were being conducted through at least the upper AV nodal level. But since there are more RED arrows than QRS complexes in Figure-3 — some of these flutter waves are not conducted all the way to the ventricles. What remains — is for us to draw a laddergram that supports these assumptions.
  •  
  • P.S.  IF you found the above rationale difficult to follow — PLEASE do not discourage! I am virtually certain that the serial laddergrams below will clarify what is going on.


Figure-3: I've color-coded atrial activity in the long lead V1 rhythm strip (See text).


LADDERGRAM:

The easiest way to illustrate the mechanism in today’s rhythm — is by drawing a laddergram with step-by-step annotations. I begin with Figure-4.

  • NOTE #1: For review of the Basics for HOW to read (and drawladdergrams  See ECG Blog #188).   
  • NOTE #2: For step-by-step illustration of another Case with Wenckebach conduction and dual-level AV nodal block — See ECG Blog #226 (including the ECG Video in that post).


Figure-4: The 1st step in laddergram construction — is to represent each of the P waves (or in this case, flutter waves) in the Atrial Tier. Since conduction through the atria is fast — vertical lines are used, drawn from each of the RED arrows.


Figure-5: Since all QRS complexes are narrow — each of the 13 beats in this tracing is supraventricular. Knowing this allows me to draw in conduction within the Ventricular Tier — which I represent with slightly inclined forward-directed lines with an arrow to indicate the downward direction of coduction. NOTE: I find Power Point optimal for drawing laddergrams — as it allows ready duplication of laddergram elements and precisely vertical displacement to ensure laddergram elements appear exactly below P waves and QRS complexes in the original rhythm strip.


Figure-6: As I alluded to above (under Pearl #2) — the regular long-short bigeminal pattern of group beating in association with AFlutter suggests the likelihood of  dual-level block within the AV Nodal Tier (which I represent by the horizontal dotted BLACK line). The most common situation is that there is 2:1 block of atrial impulses passing through the upper AV Nodal Tier — in which case, every-other flutter wave (RED arrows) will make it through the upper AV Nodal Tier.


Figure-7: Working on the assumption of dual-level block within the AV Nodal Tier — I've drawn RED arrow flutter waves making it through the upper AV Nodal level. BLUE arrow flutter waves do not make it through the upper level.


Figure-8: It's now time to "solve" the laddergram. We accomplish this by connecting those flutter wave impulses that have made it through the upper AV Nodal level — with that neighboring QRS complex most amenable to conduction. In Figure-8 — I do this for the first QRS complex in each of the 2-beat groups.


Figure-9: That next RED arrow flutter wave impulse that makes it through the upper AV Nodal level — only has one place to go, to be connected with a QRS complex in the Ventricular Tier. Although subtle — note slight increase in the amount of inclination for the 2nd flutter impulse in each group as it passes through the lower AV Nodal level.


Figure-10: The remaining RED arrow flutter wave that made it through the upper AV Nodal level — does not make it out of the lower level. This completes the laddergram. It should now be apparent that the mechanism of the rhythm in Figure-10 — is AFlutter with group beating due to dual-level block out of the AV node (2:1 block in the upper level with 3:2 Wenckebach conduction out of the lower level).


Final POINT: Rather than calling the rhythm in Figure-10 some form of 2nd-degree AV "block" — it's preferable to consider this rhythm simply as Atrial Flutter, in which there happens to be a dual-level division of conduction out of the AV node that is most often benign (and physiologic) as a result of the very rapid arial rate. This form of Wenckebach conduction does not represent a specific conduction defect — and chances are excellent that conversion to sinus rhythm will again result in 1:1 AV conduction.

  • Remember that in addition to 2nd-degree AV block of the Mobitz I type — there are many other types of Wenckebach conduction. These include SA Wenckebach — AFlutter, ATach and/or AFib with Wenckebach conduction — Parasystole with Wenckebach exit block — and junctional or ventricular rhythms with retrogradeWenckebach conduction, to name a few.
  • PEARL #3: Remember to consider the possibility of Wenckebach conduction whenever you recognize group beating.


==================================

Acknowledgment: My appreciation to Yousef Ayyash and Ahmed Abbas (from Amman, Jordan) for the case and these tracings.

==================================


RELATED BLOG POSTS Regarding the INFARCT:

  • ECG Blog #232 Reviews another case of a Bigeminal Rhythm. 
  • ECG Blog #186 — The AV Blocks (including a 4:30 minute Audio Pearl on When to suspect Mobitz I, 2nd-Degree AV Block).
  •  
  • ECG Blog #188 — How to Read (and DrawLaddergrams.
  •  
  • ECG Blog #229 — Why is AFlutter so commonly overlooked? (including a 10:00 minute Audio Pearl about ECG diagnosis of AFlutter — and distinction between AFlutter vs ATach). 
  • ECG Blog #226 — Works through a complex Case Study (including an 11:00 minute ECG Video Pearl that walks you through step-by-step in the construction of a laddergram with Wenckebach conduction and dual-level block within the AV node).


Thursday, July 15, 2021

ECG Blog #242 (57) — Why the Wide Beats? (Mobitz I vs II?)


The 12-lead ECG and long lead II rhythm strip shown in Figure-1 was obtained from a woman in her 60s, who was attended to by EMS (Emergency Medical Services) for chest pain and palpitations. She was hemodynamically stable at the time the ECG and rhythm strip in Figure-1 were obtained.


QUESTIONS:

  • How would you interpret the tracings in Figure-1? Should the cath lab be activated?
  • What is the rhythm? Is a pacemaker likely to be needed?


Figure-1: ECG and long lead II rhythm strip obtained by EMS outside of the hospital. NOTE: This long lead rhythm strip was not recorded simultaneously with the 12-lead.


=======================================

NOTE: Some readers may prefer at this point to listen to the 8:00-minute ECG Audio PEARL before reading My Thoughts regarding the ECG in Figure-1. Feel free at any time to refer to My Thoughts on this tracing (that appear below ECG MP-57).

=======================================


Today's ECG Media PEARL #57 (8:00 minutes Audio) — What is rate-related Bundle Branch Block? How does this differ from "aberrant" conduction.


MY Initial Approach to the ECG in Figure-1:

I thought this was a fascinating case — with important findings in both the 12-lead ECG, as well as in the long lead II rhythm strip. It's BEST to begin with the rhythm.

  • As always — Be systematic! Start with the long lead rhythm strip by addresing the KEY parameters contained in the Ps, Qs & 3Rs Approach (See ECG Blog #185).
  • TEmphasize: It is not essential to assess the 5 parameters in any particular sequence (ie, I'll often look at QRS width or regularity of the rhythm before looking for P waves — depending on which of the 5 parameters is easiest to assess for the tracing at hand)


PEARL #1: When confronted with a challenging arrhythmia such as this one, in which there are difficult parts and easier-to-interpret parts — Begin with the EASIER-to-interpret parts. Begin wth what you know!

  • The chances are good that IF you begin with what you know — then the number of elements in the tracing that are problematic will be less than what you initially thought.
  • Number the beats. Communication between colleagues is far more accurate when you number the beats to ensure you are talking about the same elements in the rhythm strip.
  • Label the P waves. This is far easier (and much faster) to do IF you use calipers — with the advantage that relationships between P waves and neighboring QRS complexes almost "magically" become more apparent once you define atrial activity (Figure-2).


Figure-2: I've labeled P waves with RED arrows in the long lead II rhythm strip. Doesn't this simple step facilitate recognition of the relationship between P waves and neighboring QRS complexes?


My sequential thought process for assessing the rhythm in the long lead II rhythm strip in Figure-2 follows below. 

  • The atrial rhythm is regular (or at least almost regular) — as shown by the very-close-to-being regular appearance of sinus P waves (ie, upright in lead II) — which I've highlighted by RED arrows in Figure-2.
  • Many of the P waves in the long lead II rhythm strip are conducting! We know this — because the PR interval preceding beats #1, 2-thru-7; 8, 9 and 10 is constant!
  • Other P waves are not conducting (ie, No QRS follows the on-time P waves that occur between beats #1-2; #7-8; #8-9; or #9-10). Therefore — some type of 2nd-degree ABlock is present because: i) There is an underlying sinus rhythm (albeit with slight sinus arrhythmia); ii) At least some P waves are conducting; andiiiAt least some on-time P waves are not conducting.
  • The QRS complex is sometimes narrow (ie, for beats #1,2,8,9,10) — and sometimes the QRS is wide! (ie, for beats #3-thru-7).


QUESTION: Are the wide QRS complexes conducting?

  • HINT: Does the PR interval in front of wide beats #3,4,5,6 and 7 stay constant? Is this PR interval in front of all wide beats the same as the PR interval in front of the narrow beats that are conducted?


ANSWER: All 10 QRS complexes in the long lead II rhythm strip are preceded by the same PR interval, which I measure at 0.20-0.21 second in duration.

  • Given wide variation of PR interval duration among normal subjects — I consider a PR interval of 0.21 second as still within the "normal" range. My preference is not to consider the PR interval as "prolonged" (ie, as 1st-degree AV block) until the PR interval clearly measures ≥0.22 second in duration in an adult.


KEY POINT: The fact that the atrial rhythm is regular and all QRS complexes in the long lead II are preceded by a constant PR interval — tells us that all of the beats in Figure-2 (regardless of QRS widthare sinus-conducted!

  • Our next task is to figure out WHY the QRS is sometimes narrow and sometimes wide.


NOTE: At this point in my interpretation — I looked at the wide beats in the 12-lead ECG (ie, All beats except the 3rd beat are wide in the 12-lead tracing shown in Figure-2).

  • As reviewed in ECG Blog #204 — the type of BBB (Bundle Branch Block) can be diagnosed within seconds by attention to QRS morphology in the KEY leads (ie, left-sided leads I and V6; right-sided lead V1).
  • QRS morphology in ECG #1 is typical for LBBB (Left Bundle Branch Block) because: i) The QRS is wide enough (ie, ≥0.12 second)ii) There is a monophasic (all-upright) R wave in left-sided leads I and V6; andiiiThere is an all negative (or predominantly negative) QRS in right-sided lead V1. 


What is Rate-Related BBB?

The subject of today's Audio Pearl (ECG-MP-57) is rate-related BBB. As illustrated in ECG Blog #32 — conduction defects may be intermittent — and at times they may be precipitated by an increase in heart rate.

  • Return to Figure-2. Note that the QRS widens when the ventricular rate speeds up (ie, beginning with beat #3) — and that the QRS becomes narrow again when the ventricular rate slows down (ie, beginning with beat #8).
  • Therefore — The reason there is intermittent QRS widening in Figure-2 is that there is rate-related LBBB.


PEARL #2: The rate of "onset" of BBB is not necessarily the same as the rate of "offset". For example — Imagine a rhythm in which there is normal conduction (with a narrow QRS complex) for sinus rhythm at a rate of 70/minute — but, QRS widening occurs when the rate increases to 80/minute. Because the rate of "offset" is not necessarily the same as the rate of "onset" — it may be that the sinus rate needs to drop to as low as 50-60/minute before BBB conduction resolves.

  • Rate-related BBB is not a common phenomenon. Although easy to recognize in Figure-2 (because all QRS complexes are sinus-conducted — and because we see both the "onset" and "offset" of the conduction defect in this single rhythm strip) — rate-related BBB is often a difficult diagnosis to make. This is especially true when the underlying rhythm is atrial fibrillation and relationships between the ventricular rate and QRS widening is not nearly as obvious as it is in Figure-2 (This was the case for the example shown in ECG Blog #32).
  • Clinically — The significance of an intermittent, rate-related BBB is similar to the clinical significance of a fixed (permanent) conduction defect. This point is relevant to today's case. Note in the 12-lead tracing in Figure-2, that although QRS widening resolves with slowing of the ventricular rate before beat #3 — the LBBB conduction immediately returns with beat #4 when the rate speeds up. The fact that LBBB persists for the rest of the tracing despite no more than the modest heart rate of ~ 65-70/minute — is a marker that this patient has some form of underlying heart disease (ie, complete LBBB is virtually never seen in the absence of some form of underlying heart disease).


Regarding the REST of the 12-Lead ECG:

Assessment of ST-T wave changes in association with BBB is a topic unto itself (For review of this topic — Please see ECG Blog #221). That said — I thought it unlikely considering the presence of LBBB — that the ST-T wave changes in Figure-2 were acute:

  • ST-T waves in the 3 KEY leads (leads I, V1, V6) are oppositely directly to the last QRS deflection in these leads, as they are supposed to be.
  • Although there is 2-3 mm of J-point ST elevation in leads V1, V2 and V3 — this amount of ST elevation is not disproportionate given the presence of LBBB (ie, as discussed in Blog #221 — the amount of J-point ST elevation does not exceed 25% of the depth of the S wave = Smith-modified Sgarbossa criteria).
  • NOTE: The S wave is cut off in lead V3. Judging by the distance between the descending and ascending limbs of the QRS complex we see in lead V3 (at the time that the S wave is cut off) — I suspect that S wave depth easily surpasses 20 mm (in which case the amount of J-point elevation and T wave peaking seen here was most probably not acute).
  • There is flattening of the ST segments in leads II, aVF, V5,V6 — but I interpreted that as nonspecific.
  • The 1 lead of potential concern was lead V4 — in which considering the modest depth of the S wave — the T wave in this lead is disproportionate. Whether this simply reflects "transition" (from a predominantly negative QRS in lead V3 — to a postive QRS in V5) — vs potential acute change I think is uncertain from this single ECG.


CONFESSION (7/16/2021) — When I first saw this tracing, In interpreted it as unlikely to represent an acute OMI ( = Occlusion-based MI). My impression was that the history of "chest pain" was not a predominant part of her presentation. That said — on reexamination of the 12-lead ECG in Figure-2 — I can not rule out the possibility of an early acute event based on this single tracing.

  • I still would not have activated the cath lab on the basis of the 12-lead ECG in Figure-2.
  • It would have been good to repeat a few serial tracings in short order (over the next 15-30 minutes) to see if any acute changes were evolving.


QUESTION: What type of 2nd-degree AV Block is present in Figure-2?


ANSWER:

We previously diagnosed the presence of some type of 2nd-degree AV Block in the long lead II rhythm strip because some of the on-time sinus P waves are not conducted.

  • As discussed in ECG Blog #236 — the type of 2nd-degree AV Block is not Mobitz I, because the PR interval does not progressively increase. Instead — the PR interval remains constant for consecutively conducted QRS complexes (between beats #2-thru-7) — which qualifies this rhythm as 2nd-Degree AV Block, Mobitz II.
  • After beat #7 — there is 2:1 AV block. Note that the PR interval remains constant for beats #8, 9 and 10 during this 2:1 conduction.
  • Consistent with Mobitz II — there is BBB, which although intermittent — is seen at the relatively modest ventricular rate of 65-70/minute in Figure-2. Whereas the QRS complex is most often narrow with Mobitz I (because of the higher anatomic level of this block) — the QRS complex is usually wide with Mobitz II.


Beyond-the-Core: Can you explain WHY 2:1 AV block begins with beat #8?

  • HINT: The answer is subtle (!) — and you'll need calipers for precise measurement of P-P intervals in the long lead II rhythm strip in Figure-2.


ANSWER:

Accounting for slight angulation of the ECG paper — I meticulously measured P-P intervals in the long lead II rhythm strip (Figure-3).

  • Note that the P-P interval gradually decreases from ~800 msec. — to as short as 720 msec. at the time that 2:1 AV block begins (which is after beat #7 in Figure-3). This decrease in the P-P interval corresponds to an increase in the atrial rate from 75/minute (for a P-P interval = 800 msec.) — to an atrial rate of ~83/minute (for a P-P interval = 720 msec.).
  • KEY Point: This suggests that there has not been a "worsening" of the degree of AV block per se — but rather a change in the atrial rate that accounts for the change in conduction. At an atrial rate of 80/minute — 1:1 conduction was possible (as seen by the fact that each of the P waves from beat #2 through beat #7 wasable to conduct to the ventricles)But at a faster atrial rate of ~83/minute — the AV node was only able to conduct 1 out of every 2 atrial impulses (resulting in 2:1 block, beginning after beat #7).
  • PEARL #3: Often ignored is the effect that a change in either the atrial and/or ventricular rate can have on the effectiveness of conduction. This underscores the importance of keeping tracking of both atrial and ventricular rates on serial tracings when assessing potential severity of conduction disorders.


Figure-3: I've meticulously measured P-P intervals in the long lead II rhythm strip.


IMPRESSION: I'd interpret the ECG in Figure-3 as showing sinus arrhythmia with 2nd-degree AV Block, Mobitz Type II.

  • There is rate-related LBBB that persists at the modest heart rate of ~65-70/minute.
  • The degree of AV block also appears to be rate-related — in that 2:1 conduction is seen when the atrial rate exceeds ~80-85/minute.
  • There are no acute ST-T wave changes on the 12-lead ECG. That said — the combination of rate-related LBBB that is seen here at relatively low heart rates — and — the Mobitz II form of 2nd-degree AV block in this woman in her 60s strongly suggests this patient has underlying heart disease, and may be in need of a pacemaker.


The Case Continues:

Two additional rhythm strips obtained on this patient are shown in Figure-4.

  • In view of our above Impression — HOW would you interpret the tracings in Figure-4?


Figure-4: Two additional rhythm strips on this patient.


ANSWER:

The 2 tracings in Figure-4 show similar findings to those that were seen in Figure-3. To facilitate interpretation — I've labeled P waves in Figure-4 with RED arrows (Figure-5).

  • Tracing A: P waves precede each of the 10 beats in this tracing with a constant PR interval. There appears to be a pause in the rhythm before beat #1 — and the P wave after beat #2 is not conducted — so this rhythm is once again consistent with Mobitz II 2nd-degree AV block. Of note — LBBB conduction is seen for each of the beats on this tracing except for beats #1 and #3, which are each preceded by a much longer R-R interval.
  • Tracing B: The first 7 beats in this tracing look like a continuation of what we saw at the end of Tracing A. LBBB conduction ends after beat #7 — because the onset of 2:1 AV block results in a slower ventricular rate that allows recovery in the bundle branch system. Overall, the atrial rate toward the end of Tracing B is slightly faster than at the beginning of this tracing — and this is probably the reason for the onset of 2:1 AV block.


Figure-5: I've labeled the P waves in Figure-4 with RED arrows.


Follow-Up to the Case (7/18/2021):

Although I lack details — the follow-up I received indicates that description of this patient's chest pain did not sound like an acute MI, and serial tracings did not show evolution (To my knowledge — the patient did not have an acute OMI). However, the patient's condition suddenly deteriorated — and emergency pacing was needed.


==================================

Acknowledgment: My appreciation to Sam Collis and Ben Swinn (from Kent, UK) for allowing me to use this case and these tracings.

==================================


Related ECG Blog Posts to Today’s Case: 

  • ECG Blog #185 — Systemic Approach to Rhythm Interpretation.
  •  
  • ECG Blog #204 — Reviews a user-friendly approach that allows diagnosis of the Bundle Branch Blocks in less than 5 seconds. 
  • ECG Blog #221 — Reviews the ECG diagnosis of Acute MI when there is BBB.

  • ECG Blog #32 — Reviews another case of Rate-Related BBB.

  • The August 17, 2020 post by me in Dr. Smith's ECG Blog — in which I review the phenomenon of Bradycardia-dependent BBB (sometimes called "Phase 4" or "paradoxical" block).
  •  
  • ECG Blog #211 — Reviews WHY some early beats and some SVT rhythms are conducted with Aberration (and why aberrant beats usually look like some form of conduction block).
  • ECG Blog #212 — Reviews what the Ashman Phenomenon is — and HOW touse this concept clinically. 
  • ECG Blog #70 — More on the Ashman Phenomenon (application of Absolute and Relative Refractory Periods).
  •  
  • ECG Blog #236 — Reviews the 3 Types of 2nd-Degree AV Block (ie, Mobitz I — Mobitz II — 2:1 AV Block).