
Today's case is about the interpretation of the 2-lead rhythm strip that is shown in Figure-1. There is no clinical information.
- WHY is there group beating?
- Is there AV block?
 |
| Figure-1: How would you interpret this 2-lead rhythm strip? (NOTE: Since the ECG grid is faded — I have drawn in the size of 2 large boxes in between beats #4-5). |
=======================================
NOTE: Some readers may prefer at this point to listen to the 5:45 minute ECG Audio PEARL before reading My Thoughts regarding the ECG in Figure-1. Feel free at any time to review to My Thoughts on this tracing (that appear below ECG MP-47).
=======================================

Today’s ECG Media PEARL #47 (5:45 minutes Audio) — Reviews the concept of a Bigeminal Rhythm (which may be due to Atrial or Ventricular Bigeminy, Wenckebach conduction — or other causes).
- NOTE: Today's Audio Pearl was previously published in ECG Blog #232 — but I am again including it here, as it is optimally relevant for today's post.
MY Sequential APPROACH to this CASE:
The QRS complex appears to be narrow in both of the monitoring leads shown. Assuming that other leads confirmed this impression — this means that the rhythm in Figure-1 is supraventricular!
- The most remarkable finding in this tracing is that there is group beating in the form of a bigeminal rhythm — with alternating long-short cycles.
===============================
PEARL #1: The Differential Diagnosis of a Bigeminal Rhythm is limited. It includes the following entities:
- Sinus rhythm with atrial or junctional bigeminy (ie, every-other-beat is a PAC or a PJC).
- Ventricular bigeminy (ie, every-other-beat is a PVC).
- SA ( = Sino-Atrial) Block.
- Mobitz I, 2nd-Degree AV Block ( = AV Wenckebach) with 3:2 AV conduction.
- Mobitz II, 2nd-Degree AV Block.
- Atrial fibrillation, atrial tachycardia or atrial flutter with Wenckebach conduction.
- "Escape-Capture" Bigeminy (the 1st beat in each group is a junctional or ventricular escape beat — followed by a conducted beat).
===============================
SUGGESTION: I find it helpful whenever I encounter a bigeminal rhythm to keep the above possibilities in mind as I assess the rhythm!
===============================
Continuing with My Sequential Thought Process:
Regarding P Waves in Figure-1 — There is definite atrial activity, which is seen best in lead V1. At this point, as I often suggest — the simple act of labeling P waves greatly facilitates assessment of the possible relationship between atrial activity and neighboring QRS complexes (RED arrows in Figure-2).
- RED arrows in Figure-2 indicate that atrial activity is regular. Judging by the size of the 2 large boxes that I drew in (between beats #4-5) — the atrial rate is ~250/minute.
- As expanded upon in ECG Blog #229 — the gentle "sawtooth" pattern in lead II, in association with rapidity of the atrial rate makes it more likely that the underlying rhythm is AFlutter (rather than ATach). Technically then — the RED arrows in Figure-2 highlight "flutter waves" rather than "P waves".
 |
| Figure-2: I've labeled P waves (flutter waves) with RED arrows in the long lead V1 rhythm strip. |
QUESTION: Are any of the flutter waves that we see in Figure-2 being conducted to the ventricles?
- HINT: Are there any PR intervals that repeat?
ANSWER: There are several clues that tell us that at least some of the flutter waves in Figure-2 are being conducted to the ventricles. These include the fact that:
- Group beating is present — in which the duration of each of the short R-R intervals is constant — and duration of each of the longer R-R intervals is also constant. This is not to say that conduction is not possible when group beating is not as consistent as it is in Figure-2 — but rather to emphasize that seeing how precise duration of alternating short-long R-R intervals is, tells us that there is a definite fixed ratio of flutter wave conduction!
- There are 2 sets of repetitive PR intervals in Figure-2. To facilitate recognizing this — I have selected different colors for each of the flutter waves in Figure-3.
PEARL #2 — To Facilitate Understanding What We Are Looking For in Figure-3:
- Because of their rapid atrial rate — both AFlutter and ATach often manifest Wenckebach conduction. We can immediately suspect the presence of Wenckebach conduction out of the AV node with either AFlutter or ATach whenever we see group beating (as we do in Figure-3).
- When the groups of beats with AFlutter manifest a bigeminal pattern (as they do in Figure-3) — there will usually be a dual-level of block as flutter waves exit from the AV node. In such cases — the ratio for conduction of flutter waves in the upper AV nodal level is often 2:1.
- When the atrial rate is rapid (as it is with both AFlutter and ATach) — P waves (or flutter waves) that are close to the next QRS complex will usually not be able to conduct. This is because of the phenomenon known as "concealed" conduction — in which the very rapid rate of atrial impulses arriving at the AV node "overwhelms" the ability of the AV node to conduct each of these atrial impulses normally. This leads to a "delay" in conduction time that we do not directly see on the ECG (therefore use of the term "concealed" conduction).
- In Figure-3 — WHITE arrows highlight atrial activity with too short of a PR interval to conduct. Atrial activity highlighted by BLUE arrows definitely can not conduct — as it occurs simultaneous with the QRS complex, at which time the ventricles are refractory. This leaves us with the presumption that RED arrows that precede each of the short R-R intervals must be conducting ( = the RED arrows seen before beats #2, 4, 6, 8, 10 and 12).
- Since the AV conduction ratio in the upper AV nodal level is often 2:1 — this presupposes that alternate flutter waves are probably conducting ( = the RED arrows seen just after beats #2, 4, 6, 6, 8, 10 and 12). IF this is indeed the case — then the flutter waves highlighted by the PINK arrows would not make it through the upper AV nodal level.
- Bottom Line regarding Figure-3: I suspected that only those flutter waves highlighted by RED arrows were being conducted through at least the upper AV nodal level. But since there are more RED arrows than QRS complexes in Figure-3 — some of these flutter waves are not conducted all the way to the ventricles. What remains — is for us to draw a laddergram that supports these assumptions.
- P.S. — IF you found the above rationale difficult to follow — PLEASE do not discourage! I am virtually certain that the serial laddergrams below will clarify what is going on.
 |
| Figure-3: I've color-coded atrial activity in the long lead V1 rhythm strip (See text). |
LADDERGRAM:
The easiest way to illustrate the mechanism in today’s rhythm — is by drawing a laddergram with step-by-step annotations. I begin with Figure-4.
- NOTE #1: For review of the Basics for HOW to read (and draw) laddergrams — See ECG Blog #188).
- NOTE #2: For step-by-step illustration of another Case with Wenckebach conduction and dual-level AV nodal block — See ECG Blog #226 (including the ECG Video in that post).
 |
| Figure-4: The 1st step in laddergram construction — is to represent each of the P waves (or in this case, flutter waves) in the Atrial Tier. Since conduction through the atria is fast — vertical lines are used, drawn from each of the RED arrows. |
 |
| Figure-5: Since all QRS complexes are narrow — each of the 13 beats in this tracing is supraventricular. Knowing this allows me to draw in conduction within the Ventricular Tier — which I represent with slightly inclined forward-directed lines with an arrow to indicate the downward direction of coduction. NOTE: I find Power Point optimal for drawing laddergrams — as it allows ready duplication of laddergram elements and precisely vertical displacement to ensure laddergram elements appear exactly below P waves and QRS complexes in the original rhythm strip. |
 |
| Figure-6: As I alluded to above (under Pearl #2) — the regular long-short bigeminal pattern of group beating in association with AFlutter suggests the likelihood of dual-level block within the AV Nodal Tier (which I represent by the horizontal dotted BLACK line). The most common situation is that there is 2:1 block of atrial impulses passing through the upper AV Nodal Tier — in which case, every-other flutter wave (RED arrows) will make it through the upper AV Nodal Tier. |
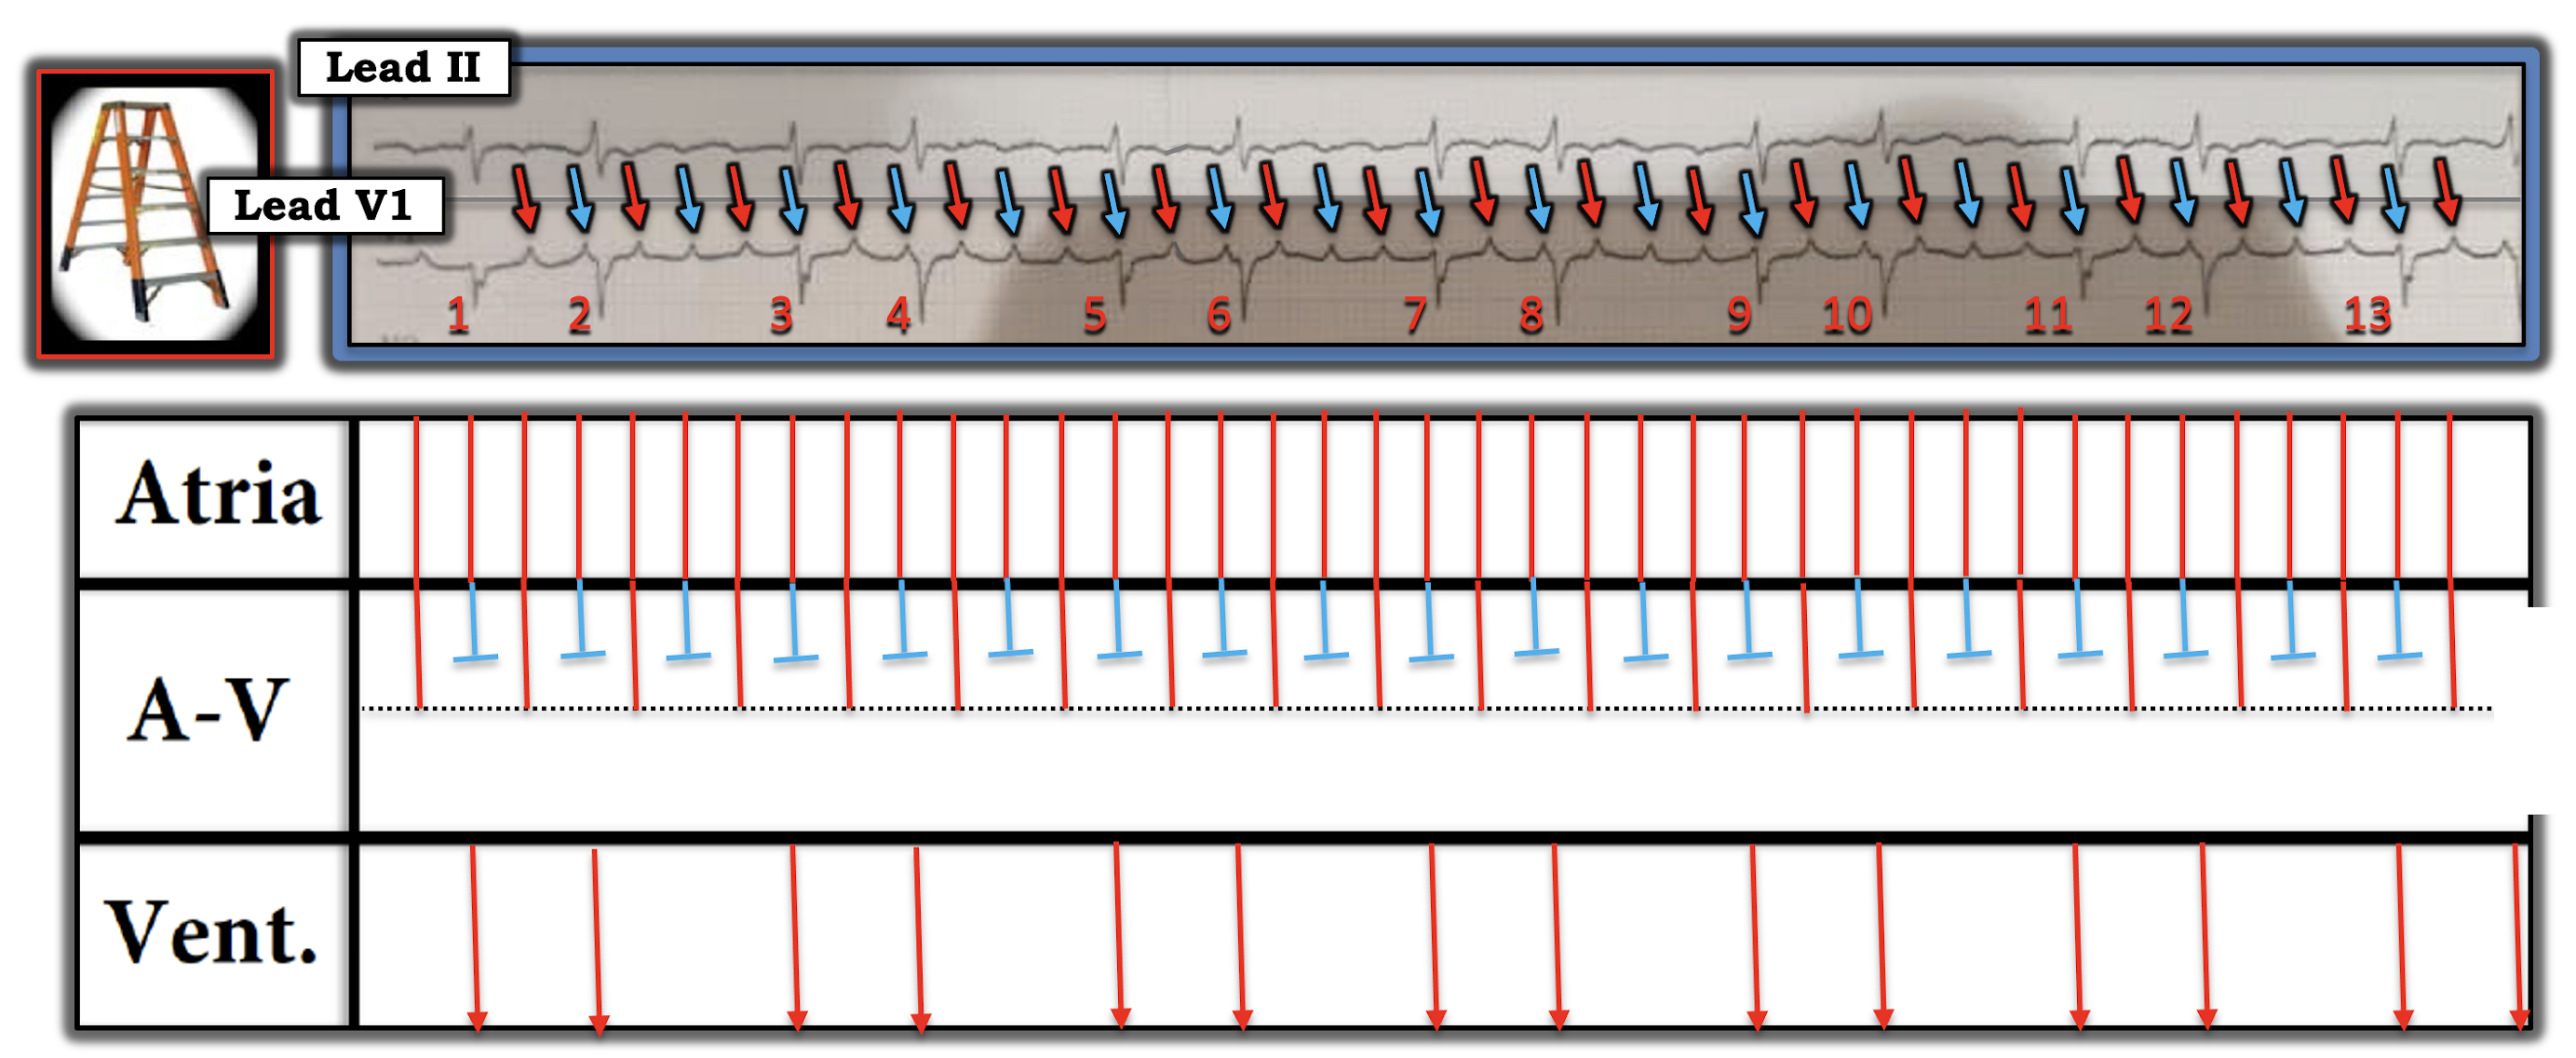 |
| Figure-7: Working on the assumption of dual-level block within the AV Nodal Tier — I've drawn RED arrow flutter waves making it through the upper AV Nodal level. BLUE arrow flutter waves do not make it through the upper level. |
 |
| Figure-8: It's now time to "solve" the laddergram. We accomplish this by connecting those flutter wave impulses that have made it through the upper AV Nodal level — with that neighboring QRS complex most amenable to conduction. In Figure-8 — I do this for the first QRS complex in each of the 2-beat groups. |
 |
| Figure-9: That next RED arrow flutter wave impulse that makes it through the upper AV Nodal level — only has one place to go, to be connected with a QRS complex in the Ventricular Tier. Although subtle — note slight increase in the amount of inclination for the 2nd flutter impulse in each group as it passes through the lower AV Nodal level. |
 |
| Figure-10: The remaining RED arrow flutter wave that made it through the upper AV Nodal level — does not make it out of the lower level. This completes the laddergram. It should now be apparent that the mechanism of the rhythm in Figure-10 — is AFlutter with group beating due to dual-level block out of the AV node (2:1 block in the upper level with 3:2 Wenckebach conduction out of the lower level). |
Final POINT: Rather than calling the rhythm in Figure-10 some form of 2nd-degree AV "block" — it's preferable to consider this rhythm simply as Atrial Flutter, in which there happens to be a dual-level division of conduction out of the AV node that is most often benign (and physiologic) as a result of the very rapid arial rate. This form of Wenckebach conduction does not represent a specific conduction defect — and chances are excellent that conversion to sinus rhythm will again result in 1:1 AV conduction.
- Remember that in addition to 2nd-degree AV block of the Mobitz I type — there are many other types of Wenckebach conduction. These include SA Wenckebach — AFlutter, ATach and/or AFib with Wenckebach conduction — Parasystole with Wenckebach exit block — and junctional or ventricular rhythms with retrogradeWenckebach conduction, to name a few.
- PEARL #3: Remember to consider the possibility of Wenckebach conduction whenever you recognize group beating.
==================================
Acknowledgment: My appreciation to Yousef Ayyash and Ahmed Abbas (from Amman, Jordan) for the case and these tracings.
==================================
RELATED BLOG POSTS Regarding the INFARCT:
- ECG Blog #232 — Reviews another case of a Bigeminal Rhythm.
- ECG Blog #186 — The AV Blocks (including a 4:30 minute Audio Pearl on When to suspect Mobitz I, 2nd-Degree AV Block).
- ECG Blog #188 — How to Read (and Draw) Laddergrams.
- ECG Blog #229 — Why is AFlutter so commonly overlooked? (including a 10:00 minute Audio Pearl about ECG diagnosis of AFlutter — and distinction between AFlutter vs ATach).
- ECG Blog #226 — Works through a complex Case Study (including an 11:00 minute ECG Video Pearl that walks you through step-by-step in the construction of a laddergram with Wenckebach conduction and dual-level block within the AV node).
Initially, I thought it was a high grade AV block. Thank you for all tweets and interesting rhythms and explanations.
ReplyDeleteMy pleasure Polly! — :)
Delete