
The ECG shown in Figure-1 was obtained from an elderly man, who was admitted to the hospital with presumed Covid pneumonia. In addition to his pulmonary symptoms — he complained of palpitations and chest pain. No prior tracing was available. The patient was hemodynamically stable at the time ECG #1 was recorded.
- WHAT is the rhythm?
- Is this VT — or something else?
 |
| Figure-1: ECG obtained from an elderly man with chest pain, palpitations and Covid pneumonia. What is the rhythm? |
MY Thoughts on ECG #1:
I found this case challenging. It was sent to me without the benefit of any prior ECG for comparison. Below are "My Thoughts" — that I review in the sequence that they came to me:
- The rhythm in Figure-1 is a regular WCT (Wide-Complex Tachycardia) at a rate of ~150/minute — but without clear sign of sinus P waves. This immediately raises the possibility of VT (Ventricular Tachycardia). That said — since the patient is hemodynamically stable, we have the "luxury" of an additional moment to look further at the tracing.
- Despite awareness that at least 80% of all regular WCT rhythms without sinus P waves will turn out to be VT — QRS morphology in Figure-1 really does look supraventricular! This is because: i) There is a very typical RBBB morphology in lead V1, with a triphasic rSR' in which the S wave descends below the baseline and there is a taller "right rabbit ear" (ie, a slender and taller R' complex); and, ii) A prominent R wave with fairly rapid initial upstroke and terminal S wave is seen in lateral leads I and V6. (NOTE: For review of these concepts — See ECG Blog #196 and ECG Blog #211).
- I suspected that I was seeing atrial activity in several leads — possibly in the form of 2:1 AV conduction.
COMMENT: I'll emphasize that it should take the experienced provider less than 20 seconds to arrive at the above impressions.
- I'll also emphasize that at this point — I was not at all certain about the etiology of the rhythm in Figure-1. That said — My "internal" estimation for the likely diagnosis of this WCT rhythm had moved from over 80% likelihood of VT — to a much greater probability that the rhythm was some type of SVT (SupraVentricular Tachycardia) because: i) QRS morphology looked so typical for RBBB conduction; and, ii) I really thought I was seeing regular underlying atrial activity in a number of leads.
- CAVEAT #1: There are a number of forms of Fascicular VT, in which the QRS is not overly wide — and, QRS morphology may resemble RBBB conduction. Most of the time with Fascicular VT — there is a bifascicular block pattern (which we do not see here) — and there are also some slight differences from "typical" RBBB conduction (which I do not see here) — but because of this possibility of Fascicular VT, I was not yet 100% certain of a supraventricular etiology (For more on Idiopathic VT, including Fascicular VT — See ECG Blog #197).
MY Thoughts Continued on ECG #1:
Given that this patient was hemodynamically stable — I wanted to see IF I could "walk out" regular atrial activity (Figure-2):
- PEARL #1: IF I was correct that the rhythm in Figure-1 was supraventricular — then description of our assessment to this point would be that of a regular SVT rhythm without clear sign of sinus P waves, at a rate of ~150/minute. Although possible that the rhythm could represent some form of "reentry" SVT (ie, AVNRT or AVRT) — this description should immediately prompt the diagnosis of AFlutter (Atrial Flutter) until proven otherwise. Knowing the likelihood of AFlutter should facilitate our search in Figure-2 for underlying atrial activity.
- PEARL #2: Although my search for underlying (and partially hidden) atrial activity always encompasses assessment of all 12 leads — the leads I have found to be most helpful in this search for hidden atrial activity are: i) The inferior leads (surprisingly — lead III is often more helpful than lead II in finding non-sinus atrial activity!); ii) Lead aVR; and, iii) Leads V1 and V2.
- Short, vertical RED lines in Figure-2 reveal strong suggestion that there is in fact regular underlying atrial activity — with 2 P waves occurring within each R-R interval in a number of leads. That this atrial activity is being conducted — is evident from the finding that the distance (ie, PR interval) from QRS complexes in selected leads to preceding atrial activity is constant — which means that there is 2:1 AV conduction.
- PEARL #3: Although we can verify precisely regular 2:1 atrial activity with use of calipers — I'll emphasize that with practice, experienced providers can learn to instantly recognize these P-QRS relationships at the bedside (without a need to have to reach for calipers in front of an acutely ill patient).
- PEARL #4: Because of suboptimal resolution, as well as some slanting of the ECG paper in Figure-2 — I've drawn in BLACK the outline of several large boxes on the ECG grid paper. Since the P-P interval of the vertical RED lines in this figure is approximately 1 large box in duration — this confirms that the atrial rate is ~300/minute — and the only rhythm that produces regular atrial activity at ~300/minute is Atrial Flutter!
- CAVEAT #2: I am aware of rare cases of coexistent AFlutter and VT. That said — the combination of regular atrial activity at ~300/minute with 2:1 AV conduction + QRS morphology highly typical for RBBB conduction — strongly suggests that the rhythm in Figure-2 is indeed AFlutter in a patient with either preexisting RBBB or AFlutter with rate-related aberrant conduction. Clinically — since this patient was hemodynamically stable — I would have most probably begun rate-slowing medication on the assumption that the rhythm was AFlutter with RBBB conduction.
 |
| Figure-2: I've added vertical RED lines in selected leads to highlight regular underlying atrial activity. For clarity — I've oulined in BLACK the dimensions of a few large boxes, showing that the P-P interval is approximately 1 large box in duration (See text). |
=======================================
NOTE: Today's 10:00 minute ECG Audio PEARL is all about Atrial Flutter.
=======================================

Today’s ECG Media PEARL #45 (10:00 minutes Audio) — Why is Atrial FIutter so commonly overlooked? Reviews PEARLS regarding the ECG diagnosis of AFlutter — and — What's "New"? in the field, regarding distinction between AFlutter vs Atrial Tachycardia (5/29/2021).
- For those wanting a more advanced review on some newer concepts regarding AFlutter — Check Out this article by García-Cosío F et al (Clinical Approach to ATach and AFlutter, Rev Esp Cardiol 65(4):363-375, 2012).
- For more on distinction between AFlutter vs ATach — Check out Figure-4 in the Addendum below.
The Case Continues:
The rapid rhythm in Figure-2 was treated with a beta-blocker. The patient's symptoms decreased — and a follow-up ECG was obtained (Figure-3).
- WHAT does ECG #2 tell you about what the rhythm in ECG #1 was?
- Is there anything else in ECG #2 to be concerned about?
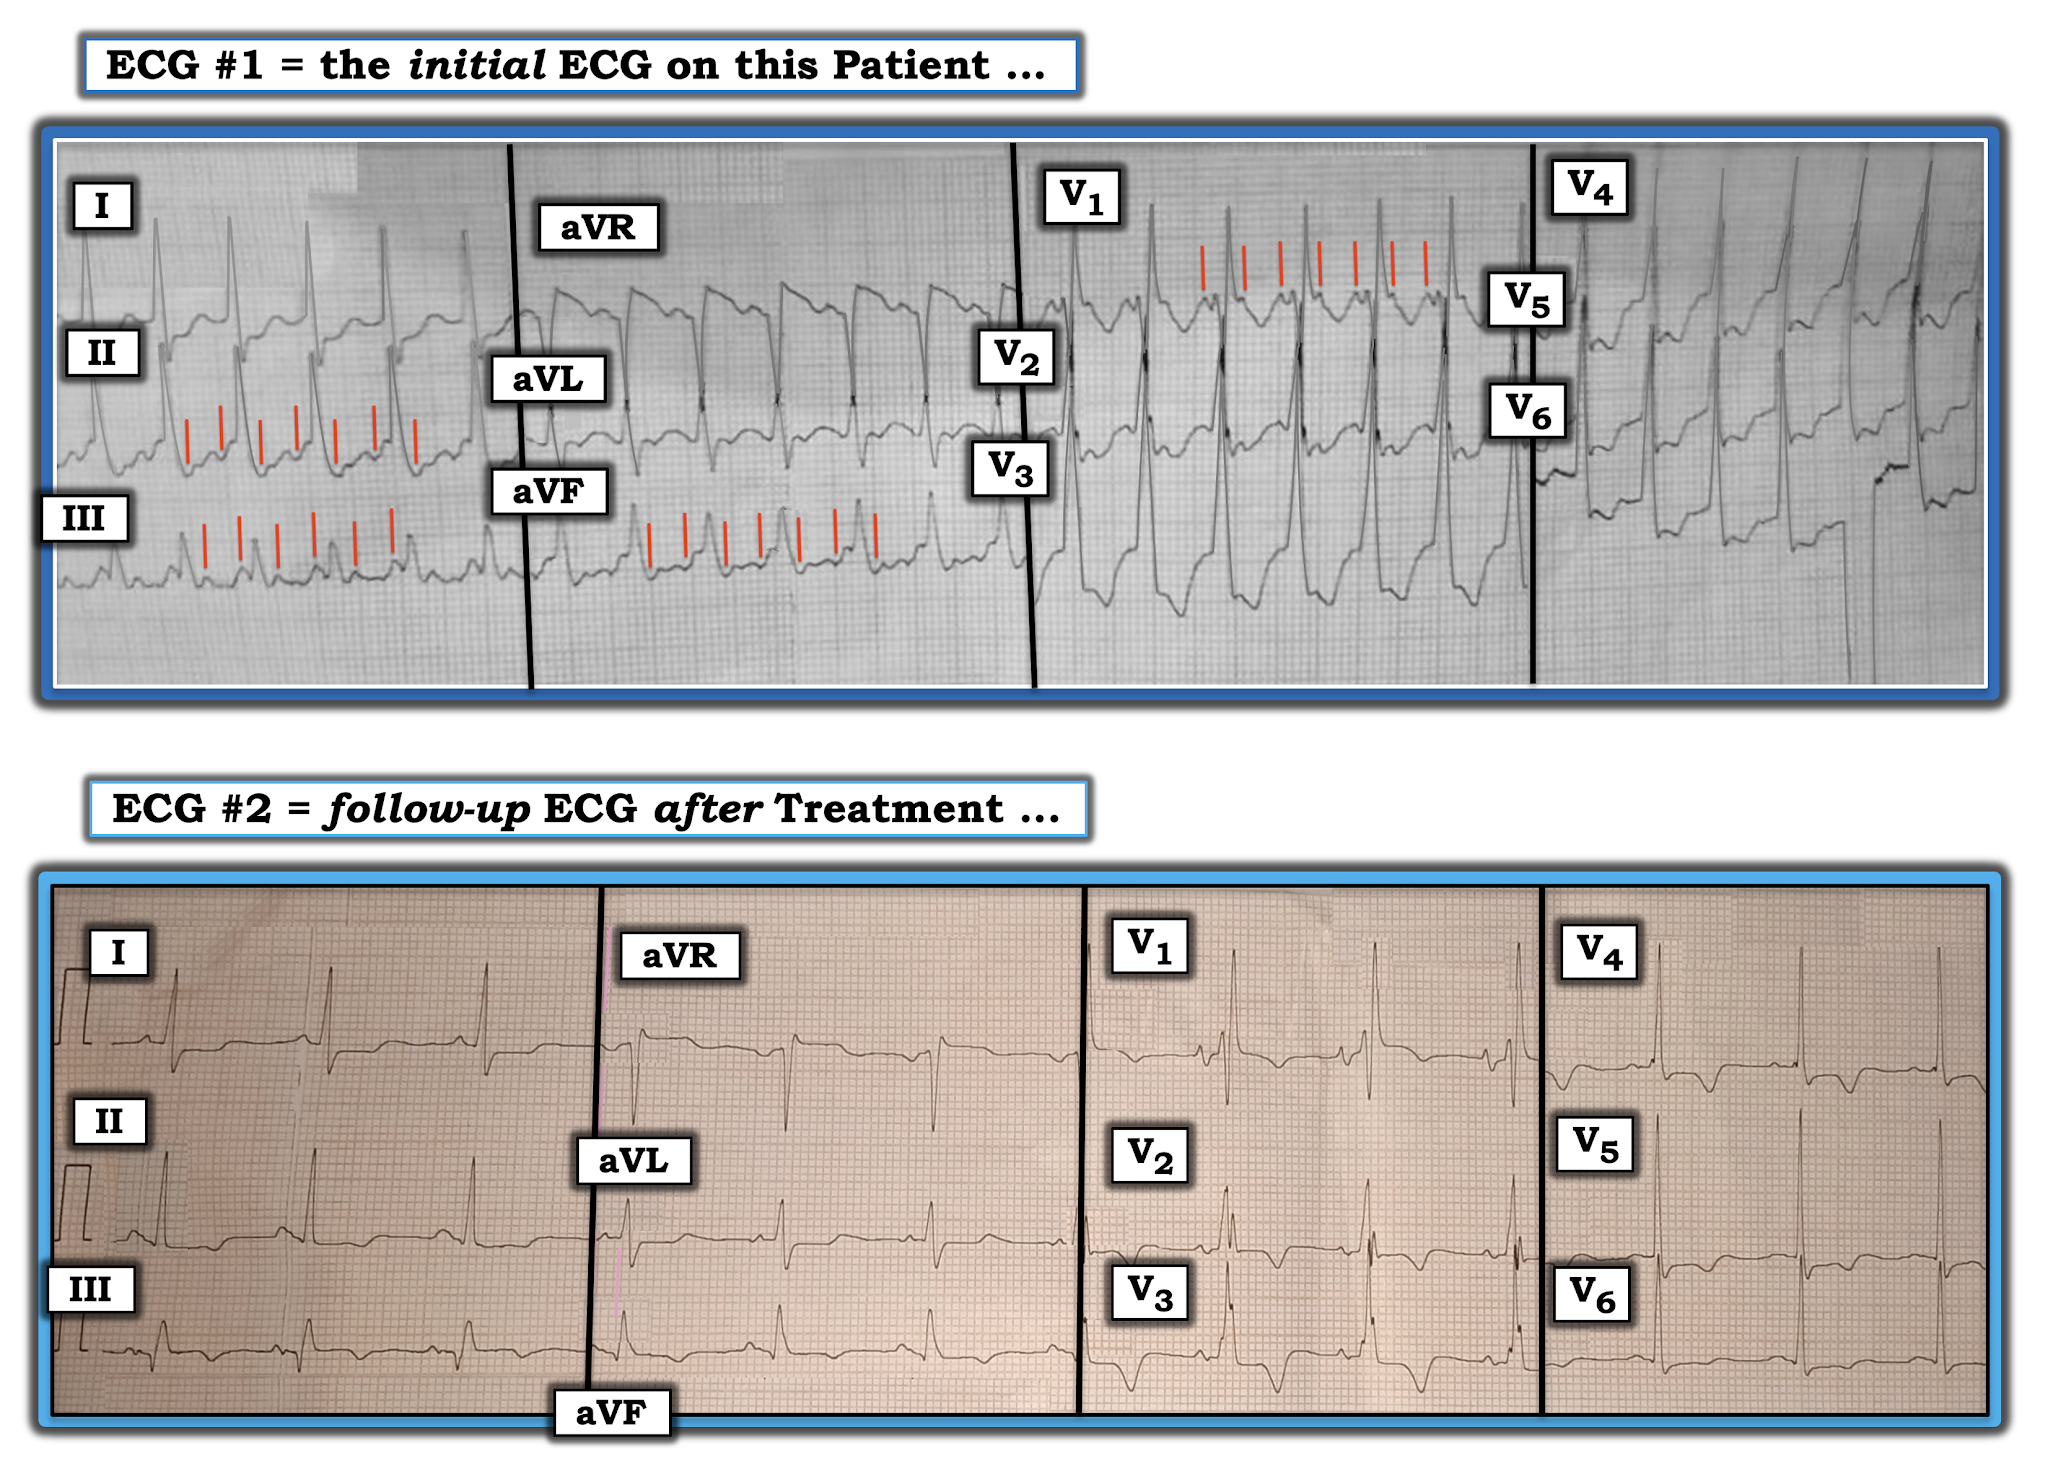 |
| Figure-3: Comparison of the initial ECG with the 12-lead tracing obtained after treatment of the fast rhythm (See text). |
MY Thoughts on Figure-3:
The "good news" — is that beta-blocker treatment successfully converted the tachycardia that was seen in ECG #1 to normal sinus rhythm (Note return of normal, upright sinus P waves, with fixed and normal PR interval in lead II of ECG #2).
- PEARL #5: The post-conversion tracing may prove invaluable for confirming the etiology of an unknown tachycardia. Proof that the rhythm in ECG #1 was supraventricular — is forthcoming from the presence of identical QRS morphology in leads I, V1 and V6 of ECG #2. Note the very typical RBBB morphology after conversion to sinus rhythm, with triphasic rSR' complex in lead V1 of ECG #2 (ie, with triphasic rSR' in which the S wave descends below the baseline and in which there is a taller "right rabbit ear" with a slender and taller R' complex). Lateral leads I and V6 manifest terminal S waves (as they should) in ECG #2 after conversion to sinus rhythm.
- Proof that the vertical RED lines in ECG #1 truly represented 2:1 atrial activity — is forthcoming from the fact that the deflections highlighted by RED ines in ECG #1 are no longer present in the baseline after conversion to sinus rhythm.
PEARL #6: The post-conversion tracing may also provide insight into the occurrence of acute ECG changes that might not have been evident during the tachycardia.
- A large Q wave is seen in lead III of ECG #2, in association with slight-but-real ST elevation and beginning T wave inversion in this lead.
- A smaller but-definitely-present Q wave is also seen in lead aVF of ECG #2, in association with flattening (albeit no elevation) of the ST segment in this lead, with beginning T wave inversion.
- Leads I, II and aVL all show similar ST segment straightening, with slight ST depression.
- Of note — the shape of the ST-T wave in lead aVL is the mirror-image opposite of the slightly elevated ST-T wave in lead III (See ECG Blog #184 for the potential significance of this finding).
- PEARL #7: There is subtle-but-real ST elevation in lead V1. This is not normal — as the expected response for the ST-T wave in lead V1 with uncomplicated RBBB is if anything, slight ST-T wave depression (See ECG Blog #204 for the expected ST-T wave appearance with BBB). Proof that the ST-T wave response in the other chest leads of ECG #2 is not normal — is forthcoming from the finding that instead of the amount of T wave inversion decreasing (as it should) as one moves from leads V1-to-V2-to-V3 — there is increased deeping of T wave inversion (which is maximal in lead V3) — and which persists with 1-2 mm of ST depression through to lead V6.
Putting It All Together:
Today's case provides an excellent example of a regular WCT rhythm that we suspected was supraventricular from the initial ECG — and, which we were able to prove was supraventricular by comparison with the post-conversion tracing.
- Focus on QRS morphology, with targeted search for hidden underlying atrial activity allowed us to quickly suspect a supraventricular etiology. Recognition of 2:1 atrial activity (in Figure-2) — with estimated atrial and ventricular rates of 300 and 150/minute, respectively — told us the rhythm was AFlutter within less than a minute.
- Despite improvement in the patient's symptoms after conversion to sinus rhythm — review of the post-conversion 12-lead tracing strongly suggested ischemia at-the-least — and, most likely the presence of reperfusion ST-T wave changes secondary to a recent infarction (See ECG Blog #194 — for review of ECG changes of coronary reperfusion).
- There is an S1Q3T3 pattern in ECG #2 ( = the post-conversion tracing) — but the S1, as well as the T3 are often "part" of the RBBB, which for all we know, may be a longterm finding in this patient (No prior tracing was available).
- Other findings on ECG #2 could clearly be consistent with acute/recent PE (inferior and anterior ST-T wave changes that could reflect RV "strain" — and subtle ST elevation in right-sided leads III, aVR, V1).
- The patient is no longer tachycardia in the post-conversion tracing (as might be expected if the cause of AFlutter was a large enough acute PE to produce both inferior and anterior ST-T wave changes of RV "strain") — BUT — use of the beta-blocker as treatment of the tachycardia (? the dose and duration of effect of that medication) may have attenuated a rapid heart rate.
- Given the above — HOW to proceed would seem to depend on one's clinical suspicion for acute/recent PE (ie, I wouldn't expect all of this patient's symptoms to resolve after conversion to sinus rhythm if the cause of AFlutter was a large PE ... — but underlying Covid pneumonia clearly put this patient at increased risk for PE, and his post-conversion ECG could clearly be consistent with this diagnosis). Bottom Line: I agree that acute/recent PE should be part of the differential diagnosis of potential causes for this patient's episode of AFlutter. Wish we had more follow-up on this patient.
==================================
Acknowledgment: My appreciation to Drs. Chamanti and Anil Kumar Kolli (from India) for the case and this tracing.
==================================
ADDENDUM (May 29, 2021): I've excerpted from my ACLS-2013-ePub this brief section that reviews some subtleties to consider when contemplating a differential diagnosis between AFlutter vs ATach (Figure-4).
 |
| Figure-4: Distinction between AFlutter vs ATach (More on this in today's Audio Pearl above). |
==================================
Related ECG Blog Posts to Today’s Case:
- ECG Blog #185 — Reviews the Ps, Qs & 3R Approach to Systematic Rhythm Interpretation.
- ECG Blog #196 — Reviews "My Take" on assessing the regular WCT (Wide-Complex Tachycardia) — with tips for distinguishing between VT vs SVT with either preexisting BBB or aberrant conduction.
- ECG Blog #211 — Reviews WHY some early beats and some SVT rhythms are conducted with Aberration (and why the most common form of aberrant conduction manifests RBBB morphology).
- ECG Blog #197 — Reviews the common forms of Idiopathic VT (including Fascicular VT).
- ECG Blog #184 — Reviews the "Magical" Lead 3-Lead aVL Relationship with acute OMI (Occlusion-based Myocardial Infarction).
- ECG Blog #204 — Reviews my "user-friendly" approach for the ECG diagnosis of BBB (including assessment of expected ST-T wave changes with RBBB and LBBB).
- ECG Blog #194 — Reviews how to tell IF the "culprit" artery has reperfused (using clinical and ECG criteria).
Thans so much .
ReplyDelete