
The ECG in Figure-1 was obtained from a 30-year-old man with palpitations. He was hemodynamically stable at the time this tracing was done.
- WHAT is the rhythm? — Is this VT or SVT?
 |
| Figure-1: ECG obtained from a 30-year-old man with palpitations (See text). |
=======================================
NOTE #1: Before working through this case — I wanted to review a fast and accurate method for estimating heart rate when the rhythm is rapid.
=======================================
Today’s ECG Media PEARL #27 (3:00 minutes Video) — Reviews the Rule of 300 for estimating heart rate — and — @ 1:25 minutes in the video, the Every-Other-Beat Method for Estimating Rate with fast rhythms.
- NOTE #2: Sometimes it is easier instead of assessing the R-R interval for every-other-beat — to assess the R-R interval for every-third- or every-fourth- beat. We illustrate this in Figure-2.
 |
| Figure-2: A short look in 2 leads at another WCT rhythm. How fast is the heart rate? |
HOW Fast is the Rate in Figure-2?
Looking every-third-beat is easiest in this example — because I found a 3-beat period in the rhythm in which a part of the QRS at the beginning and at the end falls either on (or almost on) a heavy grid line (as per the 2 vertical RED lines in Figure-2).
- I first selected a readily identifiable part of the QRS complex that begins on a heavy line. In Figure-2 — I chose the 2nd beat in lead II (See the 1st vertical RED line under this beat). Using the Every-Third-Beat Method — the amount of time that it takes to record 3 beats (RED numbers in lead II) is just under 5 large boxes (BLUE numbers in this Figure). Therefore — ONE THIRD the rate is a little faster than 300/5 ~60-65/minute.
- Therefore — the actual rate for the rhythm in Figure-2 is ~60-65 X 3 ~185-190/minute.
PEARL #1: Knowing the actual rate of a tachycardia can be extremely helpful in working through the differential diagnosis of the rhythm. This is especially true with SVT (SupraVentricular Tachycardia) rhythms because:
- While not impossible — Sinus Tachycardia becomes much less likely in a non-exercising adult IF the rate of the unknown tachycardia exceeds ~170/minute.
- Untreated AFlutter most commonly presents with a ventricular rate that is close to 150/minute (~135-165/minute range). This is because the untreated rate of flutter in the atria of adults is most commonly close to 300/minute — which with 2:1 AV conduction, results in a ventricular rate close to ~150/minute. Therefore — AFlutter also becomes unlikely when the rate of an unknown SVT rhythm exceeds ~170/minute (as this would require a ventricular rate of over 340/minute if 2:1 AV conduction was maintained).
- In contrast, an SVT rhythm for which the ventricular rate is in the range of ~140-150/minute, provides NO Clue to etiology — because each of the most common diagnostic possibilities (ie, Sinus Tach — ATach — AFlutter — AVNRT/AVRT) may all present with a ventricular rate in the range of ~140-150/minute.
=======================================
— Returning to Today’s Case —
=======================================
MY Approach to the Rhythm in Figure-1:
Unfortunately, the 12-lead ECG with long lead II rhythm strip shown in Figure-1 is “technically challenged” (ie, slanted). That said — I believe the quality of this tracing is still adequate for accurate rhythm assessment. By the “Ps, Qs & 3R Approach” that I favor (Reviewed in ECG Blog #185):
- The QRS complex is wide (clearly more than 3 little boxes = >0.12 second in duration).
- Normal sinus P waves are absent (ie, there is NO clear sign of upright P waves in lead II — See Pearl #2 below).
- There are therefore no sinus P waves that might be Related to neighboring QRS complexes.
- The rhythm is Regular (ie, despite the slant of the tracing — the QRS complex remains regular throughout the long lead II rhythm strip).
Finally, regarding the 5th Parameter in the Ps, Qs & 3R Approach — I estimate the Rate of the rhythm in Figure-1 to be ~210/minute.
- To estimate this — I used the Every-Third-Beat Method (Figure-3). I began by selecting a QRS complex for which the deep negative point of the QRS fell precisely on a heavy grid line (See the 1st vertical RED line in the long lead II under this beat).
- The amount of time that it takes to record 3 beats (RED numbers in the long lead II) is just over 4 large boxes (BLACK numbers in Figure-3). Therefore — ONE THIRD the rate is a little slower than 300/4 ~70/minute.
- Therefore — the actual rate for the rhythm in Figure-3 is ~70 X 3 ~210/minute.
PEARL #2: I can not rule out the possibility that the negative deflection seen in each of the 3 inferior leads at the end of the QRS complex in Figure-3 (BLUE arrows) might represent retrograde atrial activity. That said, even IF this was retrograde 1:1 VA conduction — this would not help diagnostically, because both VT and reentry SVT rhythms may manifest 1:1 VA conduction.
- After conversion to sinus rhythm — we’ll be able to tell IF this negative deflection did indeed represent retrograde atrial activity (IF it did — then this negative deflection highlighted by the BLUE arrows in Figure-3 should no longer be present once sinus P waves return).
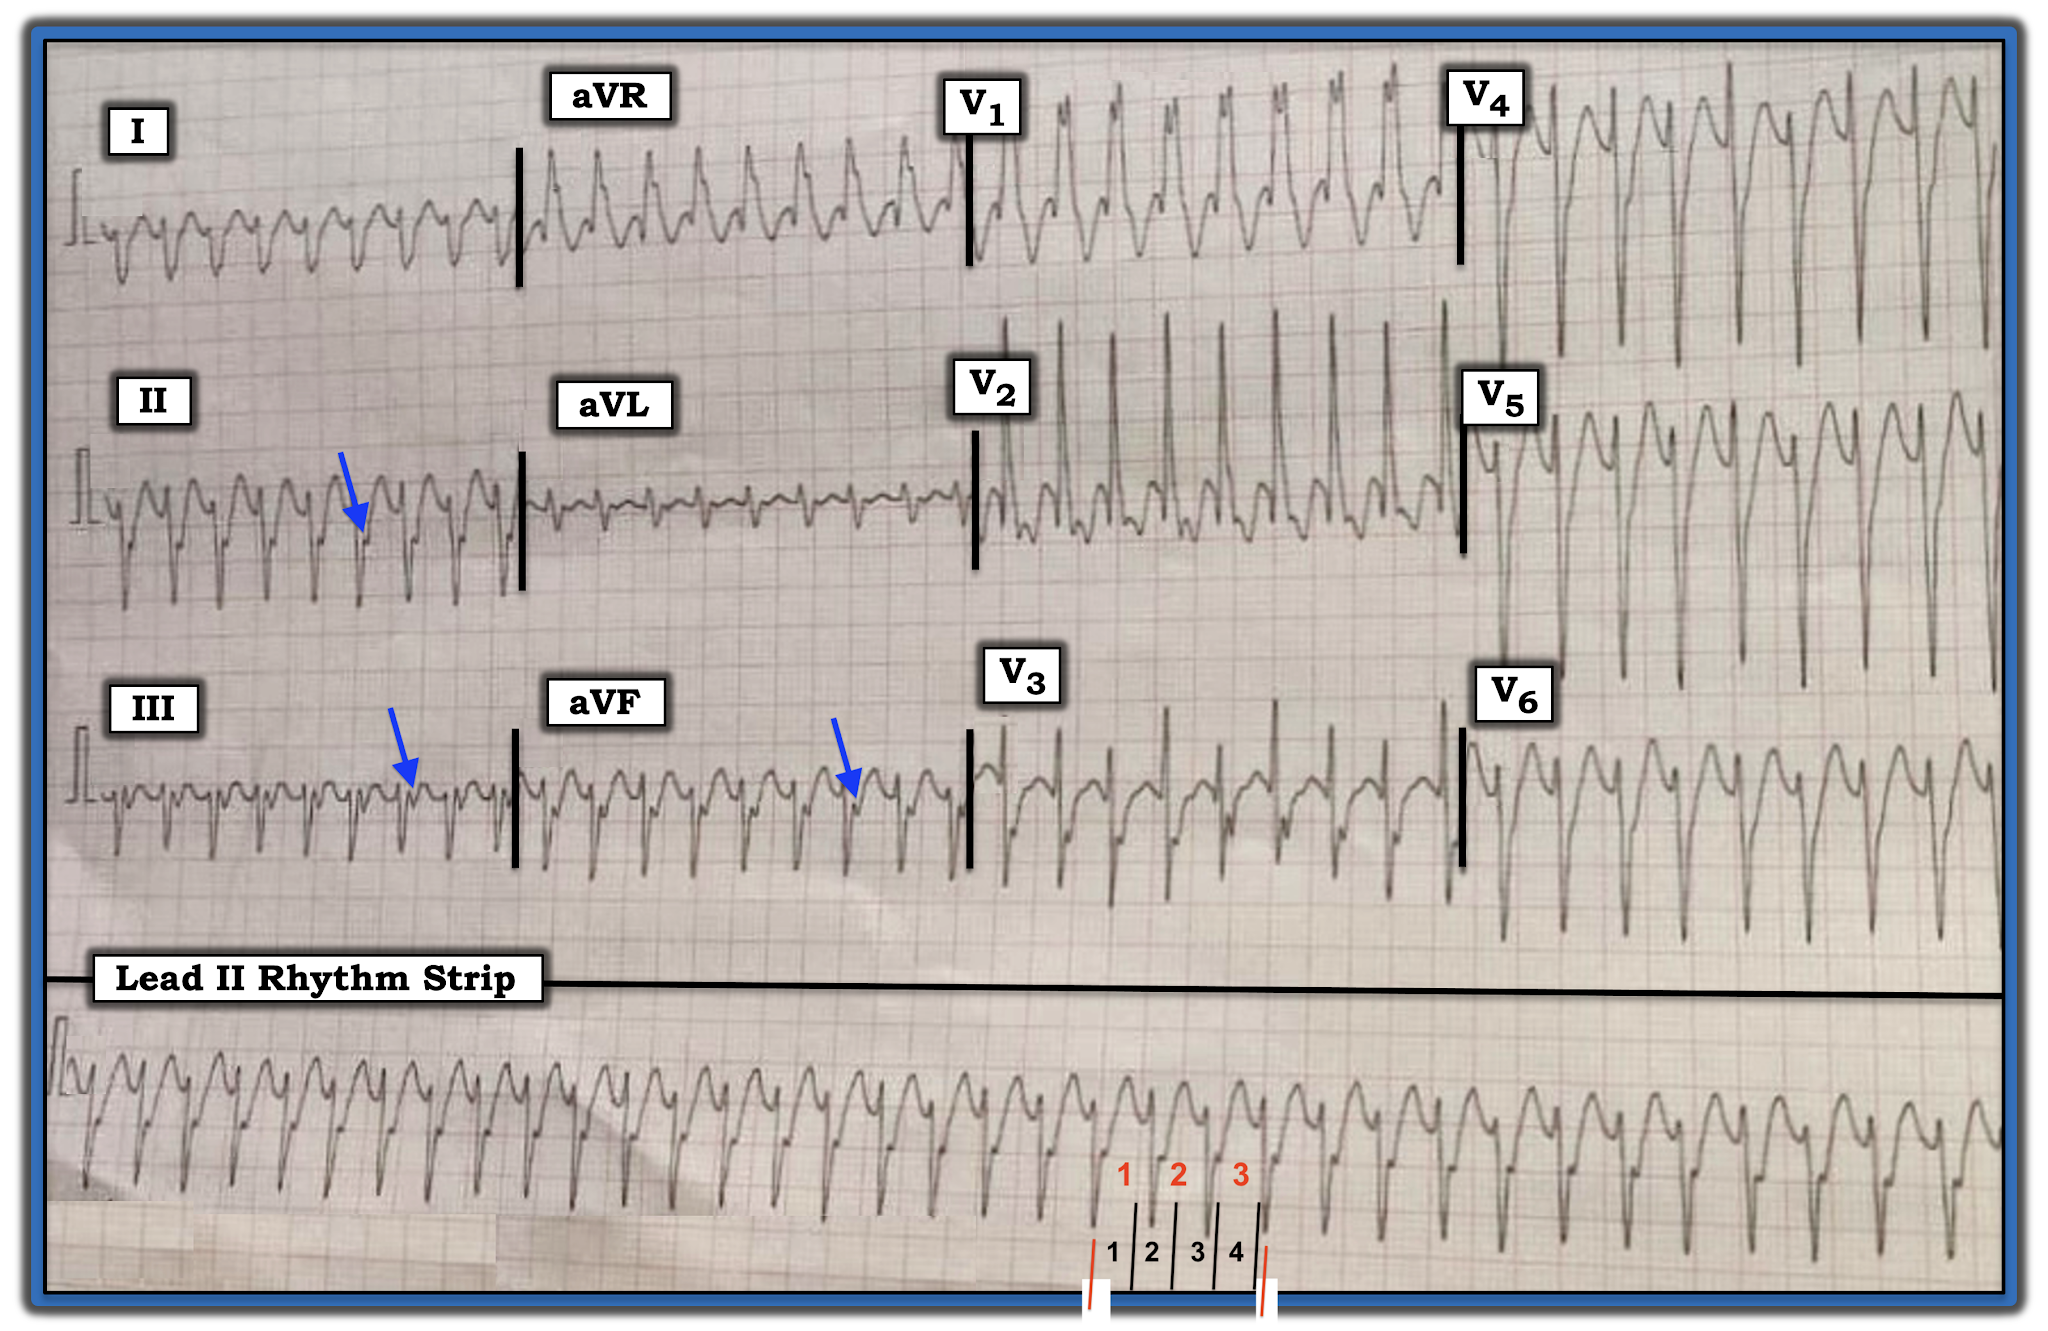 |
| Figure-3: I’ve labeled Figure-1 with BLUE arrows (that highlight possible retrograde atrial activity) — and, with RED and BLACK numbers in the long lead II rhythm strip to illustrate how I estimated heart rate (See text). |
Putting It All Together:
By the Ps, Qs & 3R Approach — we have defined a regular WCT (Wide-Complex Tachycardia) Rhythm at ~210/minute, without clear sign of sinus P waves.
- The fact that the patient is a young adult (ie, a 30-year-old man) — does not rule out the possibility of VT. As discussed in detail in ECG Blog #197 — some form of idiopathic VT (ie, VT in a patient without underlying heart disease) is more common among young adults than is often appreciated — especially when onset of the regular WCT rhythm occurs during activity.
- The “good news” — is that: i) The overall course and prognosis (both short-term and long-term) of idiopathic VT tends to be much better than for ischemic VT; and, ii) Initial treatment (with either Adenosine or Verapamil/Diltiazem — depending on the type of idiopathic VT, as discussed in Blog #197) is often successful in converting the WCT rhythm, regardless of whether the etiology is idiopathic VT or some form of SVT with aberrant conduction.
- Aberrant conduction generally manifests a QRS morphology typical for some form of known conduction block — either RBBB, LABB; one of the hemiblocks (ie, LAHB, LPHB) — or bifascicular block (ie, RBBB/LAHB or RBBB/LPHB).
PEARL #3: IF QRS morphology during the WCT rhythm is completely typical for some form of known conduction block — this strongly favors a supraventricular etiology. IF on the other hand, QRS morphology during the WCT rhythm is clearly atypical for any known form of conduction block — this favors VT.
- That said — Exceptions always exist. Nothing is 100%. For example — SVT rhythms may manifest extremely atypical QRS morphology during a WCT if the patient’s baseline ECG shows the same very atypical QRS morphology (as might occur if the patient had severe underlying ischemic heart disease, congenital heart disease, cardiomyopathy, etc). In addition, some forms of VT may simulate known conduction defects IF origin of the ventricular rhythm is near (or passes through) one or more of the conduction fascicles. KEY Point: Despite possible exceptions — I have found assessment of QRS morphology during the WCT rhythm to be extremely helpful in predicting the likely etiology of the rhythm.
- NOTE: For review of the expected QRS morphology for the bundle branch blocks, the hemiblocks, and bifascicular blocks — Please SEE ECG Blog #203 and Blog #204.
Regarding QRS Morphology in Figure-3:
QRS morphology for the regular WCT rhythm in Figure-3 resembles RBBB — because there is a wide, predominant positive QRS complex in lead V1 — with wide terminal S waves in lateral leads I and V6. That said — there are several atypical features that to me strongly suggests that this rhythm is likely to represent a form of Fascicular VT. The atypical features in QRS morphology include:
- Although QRS morphology in lead V1 of Figure-3 is wide and predominantly positive — there is no initial r wave and, the R’ deflection is both very wide and notched (whereas with typical RBBB morphology — the R’ deflection is usually thinner and not notched).
- There are anterior Q waves (seen here in leads V1 and V2) — whereas this is usually not seen with typical RBBB morphology unless there has been prior anterior infarction (which is clearly less likely to have occurred in a previously healthy 30-year-old).
- The frontal plane axis is indeterminate (ie, there is predominant negativity in leads I, II and III). Neither of the hemiblocks normally manifest predominant negativity in all 3 of the standard limb leads (whereas this pattern is not uncommon with fascicular VT).
- BOTTOM LINE: At the time that I wrote this post, I did not yet have follow-up in this case — so I do not yet have a definitive answer. That said — given that the patient is a presumably previously healthy 30-year-old man (therefore, unlikely to have a baseline ECG showing preexisting RBBB with an atypical QRS morphology) — I thought the rhythm for the ECG shown in Figure-3 was most likely Fascicular VT. I would treat the patient accordingly (ie, with initial trial of IV Verapamil, given that the patient is hemodynamically stable).
 |
| Figure-4: Use of lead V1 for assessing QRS morphology during a regular WCT rhythm (Further discussion regarding this Figure can be found on ECG Blog #196). |
-------------------------------------------------------------------------
Acknowledgment: My appreciation to Anil Kumar Kolli and Mohan Prasad (from Pradesh, India) for the case and this tracing.
-------------------------------------------------------------------------
==============================
Relevant ECG Blog Posts to Today’s Case:
- ECG Blog #185 — Reviews my Systematic Approach to Rhythm Interpretation using the “Ps, Qs & 3R Approach”.
- ECG Blog #196 — Reviews my approach to the Regular WCT.
- ECG Blog #197 — Reviews the ECG diagnosis of Idopathic VT (including RVOT VT and Fascicular VT).
- ECG Blog #203 — Reviews the expected QRS morphology for the Hemiblocks and Bifascicular Blocks (ie, LAHB, LPHB; RBBB/LAHB; RBBB/LPHB).
- ECG Blog #204 — Reviews the expected QRS morphology for Bundle Branch Block (ie, RBBB, LBBB, IVCD).
Excellent sir
ReplyDeleteThank you! — :)
DeleteGreat Dr Grauer, as always!..
ReplyDeleteFor me RS >100ms, in the setting of RBBB morphology R/S <1 in V6. Your insights in QRS morphology of RBBB are very helpful though, indeed.
@ lev — Thank you for your comment. There are numerous criteria for distinguishing between VT vs SVT with either preexisting BBB or aberrant conduction — and each has its advocates. I find criteria that depend on strict interval duration more difficult to apply in the acute situation … but there are many “correct answers” to this question — THANKS again for your comment! — :)
DeleteCorrect, axis is not inferior.
Delete@ Unknown — The axis in Figure-1 is indeterminate — because the QRS is predominantly negative in leads, I, II and III. One of the "atypical" features that favors VT over SVT with aberration in this tracing, is the finding of an indeterminate axis in the setting of an rbbb-like upright QRS in lead V1.
DeleteLVOT?
ReplyDeleteAgainst LVOT VT — is that when LVOT VT presents with a “RBBB-like” pattern — the frontal plane axis is inferior, which is different than the frontal plane axis in today’s case. I summarize the ECG findings in the most common forms of Idiopathic VT in Figure-2 of ECG Blog #197, which is found at the bottom of that post (https://ecg-interpretation.blogspot.com/2021/02/blog-197-ecg-mp-14-svt-with-aberrancy.html — :)
Delete