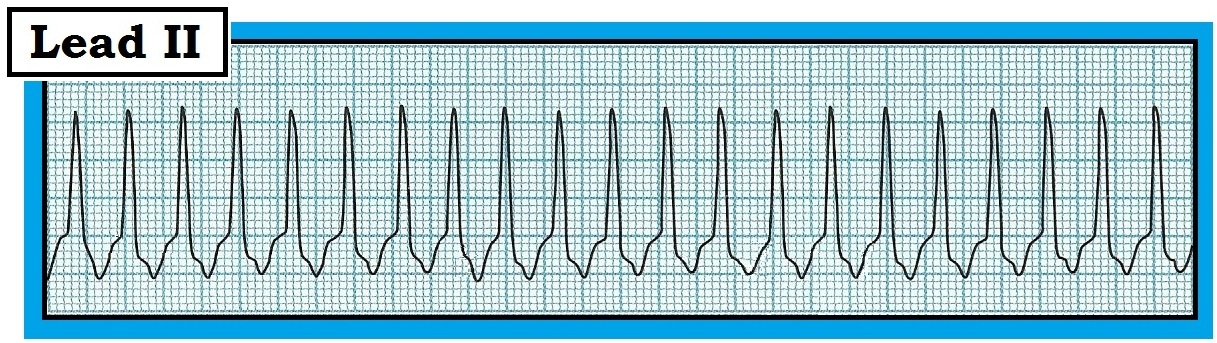
The 12-lead ECG and Lead II rhythm strip in Figure 1 was obtained from a patient admitted for an exacerbation of his COPD (chronic obstructive pulmonary disease) He is hemodynamically stable. His tracing was interpreted as showing baseline artifact (understandable given his level of dyspnea) – and sinus tachycardia. Do you agree?
.JPG) |
| Figure 1: 12-lead ECG and Lead II rhythm strip from a patient with COPD. Is this sinus tachycardia? |
INTERPRETATION: The presence of baseline artifact often makes the interpretation of an ECG more difficult. That said – artifact is a common phenomenon, and an optimal quality tracing may sometimes be an elusive goal in an acutely ill patient. The amount of artifact in Figure 1 is not excessive, and should not impede diagnosis of this arrhythmia.
- The overall rhythm is rapid and regular. The R-R interval is almost exactly 2 large boxes in duration – establishing the rate at ~150/minute.
- The QRS complex is narrow (not more than half a large box in duration).
- On initial inspection – we are uncertain about the presence and nature of P waves. A clearly defined, upright P wave in lead II is missing. That said – there appears to be at least some type of atrial activity in the lead II rhythm strip at the bottom of the tracing.
---------------------------------------------------------------
INITIAL IMPRESSION: We have described a regular SVT (SupraVentricular Tachycardia) at a rate of ~150/minute – but without normal P waves. Our Thought Process for working through the etiology of this tachyarrhythmia is as follows:
- Recognition that the rhythm is a regular SVT without normal atrial activity should immediately bring to mind the differential diagnosis of 3 common entities: i) Sinus tachycardia; ii) Atrial flutter; and iii) PSVT (Table 1). The “beauty” of this list – is that it hones the emergency care provider’s attention to the 3 principal causes that make up the vast majority of cases.
- NOTE: AFib (Atrial Fibrillation) is not included in the regular SVT LIST shown in Table 1 – because AFib is not regular. We also chose not to include Atrial Tachycardia with 2:1 AV conduction in this LIST, because in our experience ATach is much less common than the other 3 entities — and, for 2:1 conduction with a ventricular rate of ≥140/minute, this would entail an atrial rate of ~280/minute — which is significantly faster than is usually seen with ATach.
 |
| Table 1: Common causes of a regular SVT without normal atrial activity. The 3 entities listed make up over 90% of cases of what is commonly seen. |
---------------------------------------------------------------
DIFFERENTIAL DIAGNOSIS: Distinguishing between the 3 entities listed in Table 1 is not always easy. Several clues (including diagnostic maneuvers) may help. The “good news” – is that definitive rhythm diagnosis is usually not necessary before beginning treatment:
- IF the rate of the regular SVT is faster (ie, over 170/minute) – the diagnosis would almost certainly be PSVT. This is not the case in Figure 1 – which means that all 3 of the entities in the LIST must be considered.
- Statistically – the most commonly overlooked SVT rhythm is AFlutter (Atrial Flutter). This is because flutter activity may be subtle, and is not always visible in all 12 leads. By far – the most common ventricular response to AFlutter is with 2:1 AV conduction (atrial rate ~300/minute; ventricular rate ~150/minute). Therefore – One should always “Think flutter until proven otherwise” whenever you encounter a regular SVT at a rate close to 150/minute. This is the case for the rhythm in Figure 1.
- Sinus Tachycardia is part of the differential. Most of the time this rhythm is easy to recognize by the presence of a distinct, upright P wave preceding each QRS complex in lead II. Our reason for including sinus tachycardia in the regular SVT List in Table 1 – is that at more rapid rates the P wave may sometimes be hidden within the preceding ST segment. This does not appear to be the case in Figure 1 – in which if anything, a predominantly negative deflection is seen to precede each QRS complex in lead II. Thus, for practical purposes – our differential diagnosis for the rhythm in Figure 1 has been narrowed to 2 entities: AFlutter and PSVT. Statistics and the ventricular rate make us strongly suspect the former.
---------------------------------------------------------------
Additional CLUES: On close inspection – the rhythm in Figure 1 is not completely regular. Instead – the 4th beat occurs early (large black arrow in Figure 2).
- Clinical PEARL: An extremely important clue is often revealed within “the break” of any arrhythmia. A momentary change in the rhythm (even if ever-so-subtle, as after the 4th beat in Fig. 2) – may sometimes provide insight to the underlying mechanism of the arrhythmia that had not been evident initially. This is the case in Figure 2 – where despite the early occurrence of beat #4 in the lead II rhythm strip, underlying flutter waves continue unabated (as seen by the short vertical black lines in the blowup of the lead II rhythm strip).
- Use of calipers is perhaps the most time-efficient way to check out one’s suspicion that a regular SVT is atrial flutter. Simply set the length of your caliper points to the precise interval of potential flutter activity. The small, vertical red arrows in the blowup of the lead II rhythm strip of Figure 2 show doing so yields perfect “march out” at a rate of ~300/minute. This caliper point interval is exactly half the R-R interval for all beats on the tracing that occur after the early brief momentary break in the rhythm.
- Confirmation that what we are seeing is truly flutter activity can be forthcoming from detection of flutter waves in other leads. Next to the inferior leads (II,III,aVF) – lead V1 and lead aVR are common sites likely to reveal positive deflections indicative of flutter. This is especially the case for lead aVR in Figure 2 – where 2 small positive peaks are regularly present within each R-R interval. Although 2 small positive peaks are also seen in lead V1 of Figure 2 – superposition of the 2nd flutter peak on the initial portion of the QRS in this lead makes this finding far more subtle.
-To_Use.JPG) |
| Figure 2: Another look at the ECG in Figure 1. We have labeled this tracing: i) The large black arrow in lead II shows early occurrence of the 4th beat; ii) Blowup of the lead II rhythm strip shows persistent flutter waves despite early occurrence of beat #4; and iii) Small vertical red arrows show regular occurrence of 2 negative deflections for each QRS throughout the rest of the tracing. Flutter activity is also seen in lead aVR, and more subtly in lead V1. |
---------------------------------------------------------------
Use of Vagal Maneuvers: Final confirmation that the rhythm in Figure 1 is AFlutter with 2:1 AV conduction is forthcoming with use of a vagal maneuver. As discussed in detail in Section 13.0 (pdf excerpted from ACLS-2013-ePub) – this may be done by carotid massage, valsalva, or “chemical valsalva” with diagnostic/therapeutic use of adenosine.
- The large black arrow in Figure 3 shows what the effect of a vagal maneuver is likely to be for the rhythm in Figure 2. Note transient slowing of the ventricular response from 2:1 to 4:1 AV conduction that clearly reveals underlying flutter activity at ~300/minute (small vertical red lines in Figure 2). Treatment options are explored in the pdfs given in the References below.
-To_Use.JPG) |
| Figure 3: Application of a vagal maneuver (large black arrow) results in transient slowing of the ventricular response - that confirms underlying flutter at 300/minute (small vertical red lines). |
-----------------------------------------------------------------------
- Section 06.0 — on Using Adenosine -
- Section 13.0 — on SVT of Uncertain Etiology -
- Section 14.0 — on Management of Basic SVT Rhythms -
-----------------------------------------------------------------------