
Interpret the ECG
shown in Figure-1 — obtained
from an adult with a recent history of atypical
chest discomfort.
- Would you classify the ECG shown in Figure-1 as a “normal” tracing?
- If not — Why not?
 |
| Figure-1: ECG obtained from an adult with atypical chest discomfort. Would you interpret this ECG as a “normal” tracing? |
------------------------------------------
Interpretation of
Figure-1: The rhythm is sinus bradycardia and arrhythmia (heart rate ~60/minute, or a bit below this).
The PR, QRS and QT intervals are all normal — as is the axis (which is about +30 degrees). There is no
chamber enlargement.
- Q-R-S-T Changes: A small and narrow q wave is seen in lead aVL. Transition is slightly delayed (the R wave becomes taller than the S wave is deep between V4-to-V5). The most remarkable finding on this ECG is ST segment flattening with slight ST depression in multiple leads.
- The amount of actual ST segment depression on this tracing is minimal (no more than 1mm in the inferior leads) — yet there is no denying that ST depression is present (See blow-up inserts in the inferior leads in Figure-2).
- There is no ST depression at all in leads I and V2-thru-V6 (Figure‑2). That said — ST-T waves are not normal in these leads. Instead — there is subtle-but-real ST segment straightening that resembles the picture in Panel B of Figure‑3.
BOTTOM
Line: The ECG in Figure-2
is not normal. Instead — there
is diffuse nonspecific ST
flattening and slight ST depression.
These changes are subtle but real.
Clinical correlation is essential for knowing how to interpret this ECG
finding. This patient may have coronary disease — possibly even severe coronary disease. On the other
hand — these changes are not acute and
they could be due in part or in combination to any of the other
potential causes of ST depression (drug
effect, electrolyte disorder, hyperventilation, acutely ill patient, etc.).
We simply cannot tell on the basis of
this single ECG.
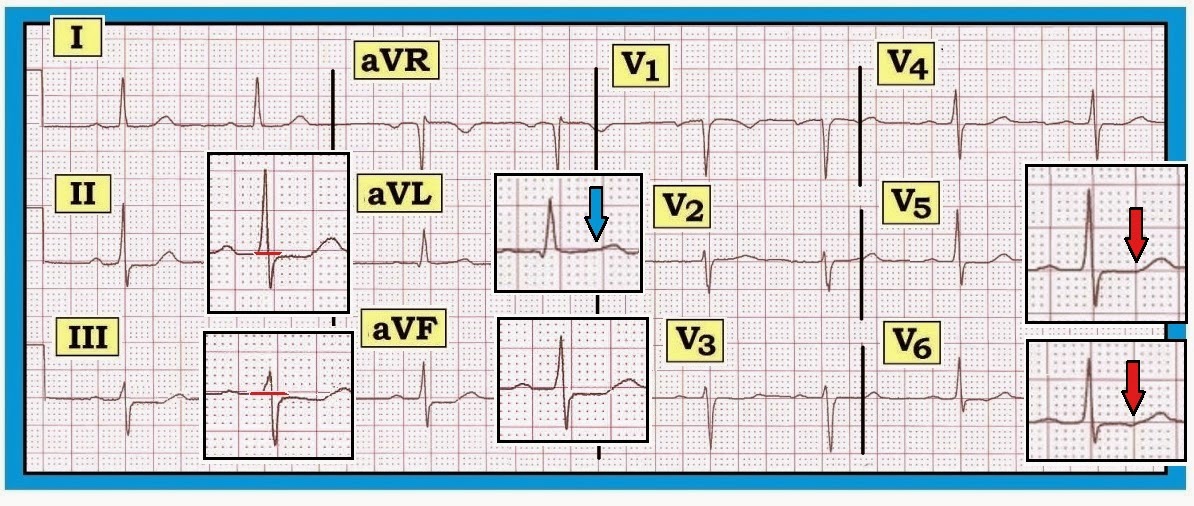 |
| Figure-2: Reproduction of the ECG in Figure-1, with blow-up inserts illustrating subtle ST-T wave abnormalities. Note that there is ST depression (of ~1mm) in the inferior leads. There is also ST segment flattening (straightening) but no depression in leads I and V2-thru-V6 (red arrows in blow-up inserts in V5,V6). Although T wave amplitude in lead aVL is reduced — note that gradual transition from ST segment-to-T-wave is preserved in this lead (blue arrow) — compared to clear straightening of the ST segment in leads V5,V6 (red arrows). This is not a “normal” ECG. |
------------------------------------------
Recognizing Subtle ST Changes: ST Segment Straightening
Consensus among expert electrocardiographers is lacking
regarding the definition of a “normal” ECG. Much of this relates to semantics —
since minor ST‑T wave abnormalities
generally provide no more than a nonspecific
suggestion to potential etiologies. That said — We feel it is important to hone
in on recognizing even minimal
abnormalities, if for no other reason than to let those reading our
interpretation be aware that we saw the
abnormality in question but did not
think it clinically important for the case at hand.
- The above said — there are times when even minimal ST-T wave changes may have clinical relevance. In addition — routine attention to recognizing subtle ST-T wave changes will go a long way toward improving one’s ECG interpretation ability.
- For example — What is the difference between the ST segment shown in Panel A vs Panel B in Figure-3? Is the admittedly subtle difference in ST‑T wave appearance between these two complexes likely to be of clinical significance? If so — How?
 |
| Figure-3: Compare the ST segment in Panel A with Panel B. What is the difference? Is this likely to be clinically significant? |
------------------------------------------
Answer to Figure-3:
The ST-T wave in Panel A is normal. Note the smooth contour at the point of
transition between the end of the S wave and the beginning of the ST
segment. Note an equally smooth
contour at the end of the ST segment and the point where the ascending
limb of the T wave begins.
- In contrast — Note the sharp angle in Panel B at the point where the straight (flat) ST segment ends and the ascending limb of the T wave begins (red arrow). While admittedly “splitting hairs” — the ST-T wave in Panel B is not normal. Instead — there is nonspecific ST segment straightening (ie, loss of that smooth transition between end of the ST segment and the beginning of the T wave ascending limb).
- We emphasize that “nonspecific ST segment straightening” — is a descriptive finding. It is nonspecific. It may mean nothing — especially if only seen in a single lead. In any case — it is not an acute change. On the other hand — ST segment straightening as occurs in Panel B may at times be a nonspecific indicator of underlying coronary disease — especially when this finding is seen in more than one lead. Clinical correlation is everything.
-------------------------------------
- For more information — GO TO:
- For a pdf of Section 09.0 — on ST-T Wave Changes (from our ECG-2014-ePub).
-------------------------------------
I remember when Barney Marriott used to say that the ST segment should not "hug the baseline."
ReplyDeleteThanks for your comment. GREAT saying by Marriott (who had MANY great sayings).
ReplyDeleteHi! Can you help me with my ekg answer?!
ReplyDeleteHello Mawa. What is your question?
DeleteThis comment has been removed by a blog administrator.
ReplyDeleteSimple yet very important post, easy to miss subtle changes which i see happening very often,significant findings especially in typical chest pain patient needing serial ECGs.. Thanks for this..
ReplyDeleteTHANKS for your comment — :)
Delete