

The ECG in Figure-1 is from a patient with chest pain, obtained several hours after cardiac catheterization.
QUESTIONS:
- Are there Q waves or Q wave "equivalents" in the inferior and anterior leads of ECG #1?
- What else would YOU say about this tracing?
ANSWER: My thoughts on this ECG appear at the bottom of this post below the following "mini-didactic" on Septal vs Infarction Q waves.
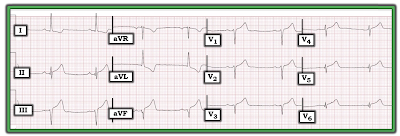 |
| Figure-1: ECG obtained several hours after cath from a patient with chest pain. (Please note that this ECG is from the case presented in the November 20, 2019 post in Dr. Smith's ECG Blog). |
================================
NOTE: I have updated this content on pointers related to Q Wave assessment from ECG Blog #94 that I wrote in 2014 — and I've added an illustrative clinical case.
- My revised 4:30 minutes ECG Video (MP-78) on how we define "Q Waves" — and how to distinguish "normal" septal Q waves from Infarction Q waves appears further down in this post!
- CLICK HERE — to download a PDF summary on assessment of Q Waves and for determining the ST Segment Baseline (from my ECG-2014-ePub).
- ECG Blog #205 — Reviews my Systematic Approach to 12-Lead ECG Interpretation (including an Audio Pearl).
===============================
Assessing for Q-R-S-T Changes: Looking for Q Waves
Simply stated — a Q wave is defined as the 1st downward deflection of the QRS complex (Figure-2):
- Small and narrow Q Waves (as seen in Panel A of Figure-2) — are often normally seen in healthy subjects. This is particularly true when such small and narrow q waves are present in one or more of the lateral leads (leads I, aVL; V4,V5,V6) — especially if the clinical scenario and the rest of the ECG appears to be benign.
- In contrast — large and wide Q Waves (as in Panel B) — are much more likely to indicate that at some point there has been an MI (Myocardial Infarction). The larger and wider the Q waves are — and, the more leads in which they are seen — the more likely it becomes that they indicate prior MI.
- The 3rd possibility regarding Q waves in seen in Panel C — in which there is an all-negative complex. Because there is no positive deflection (ie, no R wave) — We are unable to tell if the all-negative deflection that is seen is: i) a Q wave; ii) an S wave; or, iii) some combination of the two. As a "compromise" — this pattern is called a QS complex.
- NOTE: For communication and clarification purposes — we favor use of large or small-case letters for description of Q waves, depending on whether the Q wave is wide and at least 3 mm ( = 3 little boxes) deep (Figure-2).

Clinical Points Regarding Figure-2:
- A QS pattern is most commonly seen in one or more of the anterior leads. Depending on other parameters (such as QRS complex width and ST-T wave appearance) — clinical implications of a QS pattern may be similar to clinical implications of a wide Q wave ( = possible previous infarction) — especially if QS complexes are seen in multiple leads. On the other hand — the presence of one or more QS complexes may be a normal finding (See discussion of R wave progression in ECG Blog #269).
- PEARL #1: All bets are off! — IF QS complexes are seen in a patient with QRS widening from LBBB (Left Bundle Branch Block). In this situation — anterior QS complexes are not only common, but an expected accompaniment of LBBB (See my Review on BBB in ECG Blog #204).
- Even when large and wide Q waves indicate that prior infarction has taken place (as would be suggested by Panel B) — the mere presence of such Q waves does not tell us anything about the "age" of the infarct (ie, whether it occurred years ago — or fairly recently).
- To determine IF an MI might be "acute" (ie, beginning within the past few hours — and possibly still ongoing) — We use a combination of: i) History (ie, Is there new-onset chest pain? — or — Is chest discomfort more of a longterm problem without recent onset?); ii) Serial ECGs (for assessment of ST-T wave changes); iii) Cardiac markers (ie, troponin); and, iv) Other tests (ie, Echo at the bedside, looking for wall motion abnormality during chest pain — or — Cardiac Cath, as the definitive test looking for acute coronary occlusion).
- PEARL #2: While we often think of Q waves as a longstanding marker of prior infarction — it's important to appreciate that Q waves may sometimes develop rapidly (ie, in as little as 1-2 hours after the onset of symptoms). This point emphasizes the importance of the History and comparison with prior tracings for optimal understanding of the meaning Q waves have in any particular case.
- PEARL #3: And, although deep and wide Q waves often serve as a “marker” of prior infarction — this ECG sign is not without exceptions. Certain conditions (ie, cardiomyopathy) may produce Q waves not due to infarction (See ECG Blog #45). Further complicating assessment of Q waves on ECG — is the clinical reality that infarction-related Q waves do not always persist after the event. With time — Q waves may either decrease in size or disappear entirely. As a result — even small q waves may at times be a “marker” of prior infarction (ie, if a previously large infarction-Q-wave shrunk in size but did not disappear). Awareness of the clinical history and what the patient’s baseline ECG looked like would be needed to know if persistent small q waves in that patient were serving as a marker of prior infarction (assuming lead placement issues and a shift in axis were not the reasons for change in Q wave morphology).
- Bottom LINE: The term, "significant" Q wave is potentially misleading — because the size of a Q wave is not necessarily a reliable indicator of infarction. Instead of using this term — I favor describing the location and relative size of Q waves in my Descriptive Analysis — and then correlating clinically (ideally with review of prior tracings for comparison) to determine the likely significance of this finding.
==============================
ECG Media Pearl #78 (4:30 minutes Video) — ECG Blog #270 — Reviews how we define, "Q Waves" — and how to distinguish "normal" septal Q waves from Infarction Q waves.
==============================

Let's return to the case I presented at the beginning of this post.
The ECG in Figure-1 is from a patient with chest pain, obtained several hours after cardiac catheterization.
QUESTIONS that I Asked:
- Are there Q waves or Q wave "equivalents" in the inferior and anterior leads?
- What else would YOU say about this tracing?
ANSWER: The ECG in today's case was taken from a patient who was found to have multi-vessel coronary disease and an acute inferior infarction. My purpose in selecting this tracing was to focus on the variety of Q-waves and Q-wave "equivalents" that are seen, which I've labeled in Figure-3. Significant ECG findings in this tracing include the following:
- The rhythm in Figure-3 is sinus bradycardia at ~50/minute. Regarding intervals — the PR interval is upper normal (ie, ~0.20 second) — the QRS in narrow — and the QTc is normal. There is a leftward axis of about -30 degrees (isoelectric QRS in lead II — therefore not negative enough to qualify as LAHB). There is no chamber enlargement.
Regarding Q-R-S-T Changes:
- Q waves and/or Q wave "equivalents" are seen in multiple leads.
- Small and narrow q waves are seen in high-lateral leads I and aVL. These q waves look like normal septal q waves (because of their small size and lateral location).
- I call the QRS complex in lead II a "Q-wave equivalent" — because for all practical purposes, clinical implications are the same as they would be for a legitimate Q wave. Note that there is an ever-so-tiny initial upward deflection to this QRS complex in lead II (RED arrow in lead II) — which is the reason this technically is not a "Q wave", but rather an rsR'S' complex. PEARL #4: In my experience, when the only thing negating the definition of a Q wave is a tiny initial positive deflection in a tracing that otherwise indicates acute infarction — this effectively serves as a marker for infarction.
- In lead III — there is an rS complex, with a tiny-but-definitely-present initial r wave in this lead (RED arrow in lead III). By itself — this type of complex would not qualify as a "Q wave equivalent" — because unlike what we see in lead II, there is no back-and-forth change between positive and negative deflections.
- PEARL #5: We need to remember that the ECG is the "net effect" of all ongoing electrical activity. Since the initial QRS deflections of LAHB (Left Anterior HemiBlock) and Inferior Infarction Q waves are oppositely directed — it can be extremely challenging at times to determine IF a patient has inferior lead infarction Q waves — OR — rS inferior lead complexes from LAHB — OR — some combination of the two. Therefore, in Figure-3 — although the QRS in lead II is not predominantly negative enough to qualify as LAHB, it is possible that both inferior MI and LAHB are present (ie, the QRS complexes in both leads III and aVF are very much consistent with LAHB).
- Because of the slow heart rate — there are only 2 QRS complexes in lead aVF. The 1st QRS complex in this lead shows a definite small-but-present initial r wave, followed by a notched (fragmented) descent of the S wave (RED arrow in lead aVF). However, I do not see any initial positive deflection in the 2nd QRS complex in lead II — which qualifies this complex as a QS in lead aVF.
- PEARL #6: Regardless of whether true QRS morphology in lead aVF is an rS or QS complex — I call the "slurring" in the initial S wave descent in this lead (RED arrow in lead aVF) as a "Q-wave equivalent" — since in the context of other ECG findings of acute infarction, this "slurring" in an inferior lead serves as a marker for infarction.
- PEARL #7: Small and narrow q waves are seen in leads V5 and V6 (GREEN arrows in these leads). That said — by the concept of proportionality — these q waves are disproportionately large considering the tiny size of the R wave in leads V5 and V6. Especially in view of associated ST-T wave changes — despite their tiny size — I'd call these "infarction q waves".
 |
| Figure-3: I've labeled the initial tracing in today's case (See text). |
Regarding R-Wave Progression:
- There is poor R-Wave Progression (PRWP) in the chest leads of Figure-3 — because Transition is delayed, and does not occur until leads V5-to-V6, if then (ie, the R wave in lead V6 is barely more positive than the S wave in this lead is deep — See ECG Blog #269 for review of R Wave Progression).
- Note that although it looks as if there is a QS complex in lead V3 (BLUE arrow) — there is actually a small, initial positive deflection (r wave) to the QRS complex in this lead. Since leads V1, V2 and V3 are simultaneously recorded — the vertical dotted BLUE line in Figure-3 defines the onset of the QRS in these 3 leads.
- PEARL #8: Although lead V3 does not manifest a QS complex — there is "Loss of R-Wave" from lead V2-to-V3 — which in the context of the acute ST-T wave changes, serves as a "Q-wave equivalent" marker of anterior infarction!
Regarding ST-T Wave Changes:
- Hyperacute T-waves (that are taller, fatter-at-their-peak, and wider-at-their-base than expected) are seen in multiple leads (ie, in the 3 inferior leads — and in all 6 chest leads). Virtually all of these leads show at least slight J-point ST elevation (which attains ~1.5 mm of ST elevation in each of the inferior leads — See ECG Blog #218 for more on Hyperacute T waves).
- There is ST-T wave depression in high-lateral leads I and aVL in Figure-3. Note the mirror-image opposite relationship for the ST-T wave depression in lead aVL (including 1-1.5 mm of J-point depression) — compared to the shape of the ST elevation and hyperacute T wave in lead III. In the setting of new chest pain — this ECG finding is diagnostic of acute inferior infarction (See ECG Blog #184 for more on this topic).
Putting It All Together:
My goal in writing today's ECG Blog #270 — was to focus on the evaluation of Q waves and Q wave "equivalents" by means of didactic review and an illustrative case. Given the history of chest pain — the ECG in Figure-3 is diagnostic of acute infarction. ECG findings of concern include:
- Fairly marked sinus bradycardia.
- Signs of acute inferior infarction — including Q waves or Q wave "equivalents" in leads II and aVF — inferior lead ST elevation and hyperacute T waves — mirror-image opposite ST-T wave depression in lead aVL.
- Suggestion of acute antero-lateral infarction — including "loss" of R wave (from lead V2-to-V3) — disproportionately large q waves in leads V5 and V6 — hyperacute T waves in all 6 chest leads.
===============================
Related Material of Interest:
- CLICK HERE — to download a PDF summary on assessment of Q Waves and the ST Segment Baseline (from my ECG-2014-ePub).
- ECG Blog #205 — Reviews my Systematic Approach to 12-Lead ECG Interpretation (including an Audio Pearl).
- ECG Blog #269 — Reviews assessment of R Wave Progression (including the causes of "Poor" R wave progression).
- ECG Blog #204 — Reviews the ECG diagnosis of Bundle Branch Block (RBBB, LBBB, IVCD).
- ECG Blog #45 — Reviews the unusual ECG findings in this patient with Muscular Dystrophy (which is known for the occurrence of cardiomyopathies).
- ECG Blog #218 — Reviews what is a Hyperacute T Wave (including the Audio Pearl in this post ).
- ECG Blog #184 — Reviews the "magical" mirror-image opposite relationship with acute infarction between lead III and lead aVL (including the Audio Pearl in this post).
- Please note that the ECG shown in Figure-1 of today's case is from the November 20, 2019 post in Dr. Smith's ECG Blog. (This is ECG #5 from my figure in My Comment at the BOTTOM of the page in that Dr. Smith post).
No comments:
Post a Comment