Monday, February 24, 2014

ECG Blog #84 — Nonspecific ST-T Wave Changes

     Interpret the ECG shown in Figure-1 — obtained from an adult with a recent history of atypical chest discomfort.
  • Would you classify the ECG shown in Figure-1 as a “normal” tracing?
  • If not — Why not?

Figure-1: ECG obtained from an adult with atypical chest discomfort. Would you interpret this ECG as a “normal” tracing? 


------------------------------------------
Interpretation of Figure-1: The rhythm is sinus bradycardia and arrhythmia (heart rate ~60/minute, or a bit below this). The PR, QRS and QT intervals are all normal — as is the axis (which is about +30 degrees). There is no chamber enlargement.
  • Q-R-S-T Changes: A small and narrow q wave is seen in lead aVL. Transition is slightly delayed (the R wave becomes taller than the S wave is deep between V4-to-V5). The most remarkable finding on this ECG is ST segment flattening with slight ST depression in multiple leads.
  • The amount of actual ST segment depression on this tracing is minimal (no more than 1mm in the inferior leads) — yet there is no denying that ST depression is present (See blow-up inserts in the inferior leads in Figure-2).
  • There is no ST depression at all in leads I and V2-thru-V6 (Figure‑2). That said — ST-T waves are not normal in these leads. Instead — there is subtle-but-real ST segment straightening that resembles the picture in Panel B of Figure‑3.

BOTTOM Line: The ECG in Figure-2 is not normal. Instead — there is diffuse nonspecific ST flattening and slight ST depression. These changes are subtle but real. Clinical correlation is essential for knowing how to interpret this ECG finding. This patient may have coronary disease — possibly even severe coronary disease. On the other hand — these changes are not acute and they could be due in part or in combination to any of the other potential causes of ST depression (drug effect, electrolyte disorder, hyperventilation, acutely ill patient, etc.). We simply cannot tell on the basis of this single ECG.

Figure-2: Reproduction of the ECG in Figure-1, with blow-up inserts illustrating subtle ST-T wave abnormalities. Note that there is ST depression (of ~1mm) in the inferior leads. There is also ST segment flattening (straightening) but no depression in leads I and V2-thru-V6 (red arrows in blow-up inserts in V5,V6). Although T wave amplitude in lead aVL is reduced — note that gradual transition from ST segment-to-T-wave is preserved in this lead (blue arrow) — compared to clear straightening of the ST segment in leads V5,V6 (red arrows). This is not a “normal” ECG. 


------------------------------------------
Recognizing Subtle ST Changes: ST Segment Straightening
Consensus among expert electrocardiographers is lacking regarding the definition of a “normal” ECG. Much of this relates to semantics — since minor ST‑T wave abnormalities generally provide no more than a nonspecific suggestion to potential etiologies. That said — We feel it is important to hone in on recognizing even minimal abnormalities, if for no other reason than to let those reading our interpretation be aware that we saw the abnormality in question but did not think it clinically important for the case at hand.
  • The above said — there are times when even minimal ST-T wave changes may have clinical relevance. In addition — routine attention to recognizing subtle ST-T wave changes will go a long way toward improving one’s ECG interpretation ability.
  • For example — What is the difference between the ST segment shown in Panel A vs Panel B in Figure-3? Is the admittedly subtle difference in ST‑T wave appearance between these two complexes likely to be of clinical significance? If so — How?

Figure-3: Compare the ST segment in Panel A with Panel BWhat is the difference? Is this likely to be clinically significant?


------------------------------------------
Answer to Figure-3: The ST-T wave in Panel A is normal. Note the smooth contour at the point of transition between the end of the S wave and the beginning of the ST segment. Note an equally smooth contour at the end of the ST segment and the point where the ascending limb of the T wave begins.
  • In contrast — Note the sharp angle in Panel B at the point where the straight (flat) ST segment ends and the ascending limb of the T wave begins (red arrow). While admittedly “splitting hairs” — the ST-T wave in Panel B is not normal. Instead — there is nonspecific ST segment straightening (ie, loss of that smooth transition between end of the ST segment and the beginning of the T wave ascending limb).
  • We emphasize that “nonspecific ST segment straightening” — is a descriptive finding. It is nonspecific. It may mean nothing — especially if only seen in a single lead. In any case — it is not an acute change. On the other hand — ST segment straightening as occurs in Panel B may at times be a nonspecific indicator of underlying coronary disease — especially when this finding is seen in more than one lead. Clinical correlation is everything.

-------------------------------------
- For more information  GO TO:
  • For a pdf of Section 09.0  — on ST-T Wave Changes (from our ECG-2014-ePub).
-------------------------------------

Sunday, February 2, 2014

ECG Blog #83 — Every-Other-QRST is Different

     Interpret the 3-lead rhythm strip shown in Figure-1 — obtained from a patient in a fairly (but not completely) regular SVT rhythm.
  • What is the reason for the slight change in QRS morphology from beat-to-beat?

Figure-1: 3-lead rhythm strip — obtained from a patient in a regular SVT rhythm. What is the reason for the slight change in QRS morphology from beat-to-beat? 


Answer to Figure-1: 
Although one might at first be tempted to interpret the rhythm as a form of bigeminy — a more accurate interpretation would be electrical alternans. While we would accept general description of this rhythm as representing a “regular” SVT (SupraVentricular Tachycardia) — there is in fact slight-but-real phasic variation in the R‑R interval occurring every-other-beat. This is not due to a form of bigeminy — but rather to R‑R alternans. In addition — there is both QRS alternans (red and blue double arrows in Figure-2) — and T wave alternans (red and blue circles in Figure-2). That is — QRS morphology changes every-other-beat. This is subtle in lead V1 — but more noticeable in lead V2 where the initial R wave manifests an obvious difference in height from one beat to the next. Similarly — T wave morphology changes every-other beat, with this clearly more noticeable in lead V2 which manifests extra peaking of every-other-T wave (red and blue circles in lead V2).
  • Clinical implications of these forms of electrical alternans in a patient with SVT — are that reentry is almost certain to be involved in the mechanism. There may or may not be a concealed accessory pathway.

Figure-2: We have labeled the 3-lead rhythm strip recorded in Figure-1. There is slight shortening of the R-R interval every-other beat = R‑R alternans. In addition — there is both QRS alternans (red and blue double arrows) — and T wave alternans (red and blue circles in Figure-2). That is — QRS and T wave morphology changes every-other-beat.


What is Electrical Alternans?
The fascinating phenomenon of electrical alternans — is a relatively uncommon clinical entity that is frequently misunderstood. It is often overlooked when it does occur. A look at Figure-1 explains why: This ECG sign can be subtle indeed.
  • Electrical alternans is a general term that encompasses a number of different pathophysiologic mechanisms. Its occurrence is not limited to pericardial tamponade — but instead has been associated with an expanding array of clinical conditions.
  • Distinction should be made between electrical and mechanical alternans. The term “alternans” itself — merely indicates that there is phasic fluctuation in some cardiac signal from one beat to the next within the cardiac cycle. This may be in the strength of the pulse (or the blood pressure recorded) — or it may be in one or more waveforms in the ECG recording.
NOTE: It may be helpful to first define other alternans phenomena that may sometimes be confused with the various ECG manifestations (especially since these other forms of alternans phenomena may also be seen with cardiac tamponade).
  • Pulsus alternans — is a mechanical form of alternans. The rhythm is regularbut cardiac output varies from beat-to-beat. It is seen with severe systolic dysfunction. Pulsus alternans should be distinguished from a bigeminal pulse — in which a weaker beat follows the stronger beat by a shorter time interval (as occurs when the alternating beat is a PVC, which understandably generates less cardiac output).
  • Pulsus alternans should also be distinguished from pulsus paradoxus — in which there is a palpable decrease in pulse amplitude (or a measured drop of >10mm in blood pressure) during quiet inspiration. While pulsus alternans and paradoxus may both be seen with pericardial tamponade — they are different phenomena than the various types of electrical alternans.


Electrical Alternans: Definition/Features/Mechanisms
Electrical alternans — is a beat-to-beat variation in any one or more parts of the ECG recording. It may occur with every-other-beator with some other recurring ratio (3:1; 4:1; etc.). Amplitude or direction of the P wave, QRS complex, ST segment and/or T wave may all be affected (although P wave alternans is rare). Alternating interval duration (of PR, QRS or QT intervals) may also be seen.
  • Electrical alternans — was first observed in the laboratory by Herring in 1909. It was reported clinically by Sir Thomas Lewis a year later, who characterized the phenomena as occurring, “either when the heart muscle is normal but the heart rate is very fast or when there is serious heart disease and the rate is normal”. This 1910 description by Lewis serves well to this day to remind us of the 2 principal clinical situations in which electrical alternans is most often encountered: i) Supraventricular reentry tachycardias; and ii) Pericardial tamponade.

Mechanisms: 
There are 3 basic types of electrical alternans phenomena — each relating to a different pathophysiologic mechanism: i) Repolarization alternans; ii) Conduction and Refractoriness alternans; and iii) Alternans due to abnormal cardiac motion. A common cellular mechanism may underlie each of these processes relating to abnormal calcium release or reuptake within the sarcoplasmic reticulum.
  • Repolarization alternans — entails beat-to-beat variation in the ST segment and/or T wave. Alternation in ST segment appearance (or in the amount of ST elevation or depression) — is often linked to ischemia. In contrast — T wave alternation is more often associated with changes in heart rate or in QT duration (especially when the QT is prolonged). In patients with a long QT — T wave alternans may forebode impending Torsades de Pointes. Both ST segment and T wave alternans have been known to precede malignant ventricular arrhythmias. Thus, this type of electrical alternans may convey important adverse prognostic implications when seen in certain situations. That said — a variety of clinical conditions have been associated with repolarization alternans, such that adverse prognostic implications do not always follow. Among these clinical conditions are congenital long QT syndrome — severe electrolyte disturbance (hypocalcemia; hypokalemia; hypomagnesemia) — alcoholic or hypertrophic cardiomyopathy — acute pulmonary embolus — subarachnoid hemorrhage — cardiac arrest and the post-resuscitation period — and various forms of ischemia (spontaneous or induced by treadmill testing or other stimulus).
  • Conduction and Refractoriness alternans — entails variance of impulse propagation along some part of the conduction system. This may result from fluctuations in heart rate or in nervous system activity or from pharmacologic treatment. ECG manifestations from this form of alternans may include alternating appearance of the P wave, QRS complex or alternating difference in P-R or R-R interval duration. In particular — QRS alternans during narrow SVT rhythms has been associated with reentry tachycardias. While identification of QRS alternans during a regular SVT often indicates retrograde conduction over an AP (Accessory Pathway) — this phenomenon has also been seen in patients with simple PSVT/AVNRT that exclusively limits its reentry pathway to the AV Node. Therefore — identification of QRS alternans during a regular SVT does not prove the existence of an accessory pathway. Conduction and refractoriness alternans may be seen with WPW-related as well as AV Nodal-dependent reentry tachycardias — atrial fibrillation — acute pulmonary embolus — myocardial contusion — and severe LV dysfunction. NOTE: On occasion — Alternans may be seen with monomorphic VT (Maury and Metzger).
  • Cardiac Motion alternans — is the result of cardiac movement rather than electrical alternation. The most important clinical entity associated with motion alternans is large pericardial effusion — though motion alternans has also been observed in some cases of hypertrophic cardiomyopathy. It is important to appreciate that not all pericardial effusions produce electrical alternans. Development of total electrical alternans (of P wave, QRS complex and T wave) — is likely to be a harbinger of impending tamponade. Unfortunately — the sensitivity of total electrical alternans is poor for predicting tamponade (ie, most patients who develop tamponade do not manifest preceding electrical alternans). Therefore — it may be helpful if you see total electrical alternans in a patient with a large pericardial effusion — but failure to see this ECG sign in no way rules out the possibility that tamponade is occurring. Echo studies in patients with documented cardiac tamponade confirm that electrical alternans is synchronous with and a direct result of the pendulous movement of the heart within the enlarged, fluid-filled pericardial sac of a patient with large pericardial effusion.


Electrical Alternans: KEY Clinical Points
In summary, electrical alternans is not common — but it does occur. You will see it. You have probably already seen it a number of times without even realizing it. Electrical alternans is a fascinating but advanced concept.
  • In our experience — electrical alternans is most often seen in association with regular SVT rhythms (as seen in Figure-1). Seeing it in this context suggests (but does not prove) the existence of an AP (Accessory Pathway). Regardless of whether the mechanism of the regular SVT is AVNRT or AVRT — it is likely that reentry is involved. This conclusion may prove useful in contemplating potential investigative and therapeutic interventions.
  • In a patient with pericarditis — a large heart on chest X-ray — or simply unexplained dyspnea — recognition of electrical alternans should suggest the possibility of a significant pericardial effusion that may be associated with tamponade. That said — electrical alternans is a nonspecific ECG sign that may also indicate myocardial ischemia, LV dysfunction and/or possibility of any of a number of other precipitating factors. BOTTOM Line: If you see electrical alternans — Look for an underlying clinical condition that may be responsible for this ECG sign.
  • Development of electrical alternans per se — conveys no adverse prognostic implications beyond those associated with severity of the underlying disorder. Two exceptions to this general rule are: i) In a patient with QT prolongation or severe ischemia — recognition of electrical alternans may portend deterioration to Torsades or VT/VFib; and, ii) In a patient with a large pericardial effusion — development of total electrical alternans (of P wave, QRS complex and T wave) suggests there may now be tamponade.
  • P.S. Keep in mind that not all cases of pericardial effusion will manifest low voltage and electric alternans ... (The pathophysiology behind electrical alternans with a large pericardial effusion — is a "swinging heart" within the pericardial sac. Thus, alternans is unlikely to be seen with smaller effusions — and even with larger effusions, not all cases manifest alternans ...).

-------------------------------------
ACKNOWLEDGMENT: My appreciation to Jenda Enis Stros for allowing me to use the ECG in Figure‑1.
-------------------------------------

- For more information  GO TO:

  • For a pdf of Section 14.0  — on Electrical Alternans (from our ECG-2014-ePub).
-------------------------------------

Monday, January 13, 2014

ECG Blog #82 — Serial STEMI Tracings

     
Interpret the ECG shown in Figure-1 — obtained from a patient with new-onset chest pain. There is an obvious acute STEMI (ST Elevation Myocardial Infarction). Follow-up ECGs on this patient are shown in Figure-2 (obtained a short while later) — and finally in Figure-3 (obtained post-cath/reperfusion).
  • Is there evolution of the MI on these serial ECGs? What are the specific changes you see as you compare these sequential tracings?
  • Which coronary artery is likely to be acutely occluded?
  • Was acute reperfusion successful (Figure-3)?

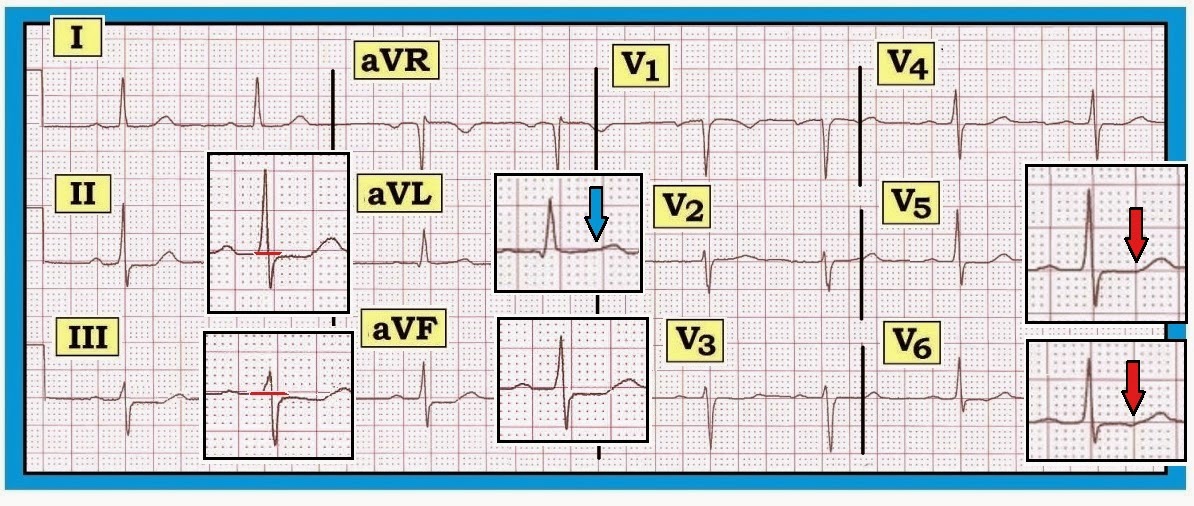
Figure-1: This is ECG #1 (blue border) — from this patient with new-onset chest pain. There is sinus bradycardia with marked precordial ST elevation. Q waves have not yet formed in the anterior leads on this initial ECG #1. Note the hyperacute appearance of ST-T waves in leads V2,V3,V4. Surprisingly — reciprocal changes are minimal (no more than slight ST-T wave flattening/depression in the inferior leads). Despite this — there can be little doubt that this ECG #1 represents a large acute STEMI in evolution.


------------------------------------------
What is the Culprit” Artery?: We suspect acute proximal LAD occlusion as the “culprit” artery for the acute STEMI seen in Figure‑1. This is suggested by the ECG finding of diffuse precordial ST elevation that is especially marked in leads V2-to-V4.
  • Acute occlusion of the LMain (Left Main) Coronary Artery is rarely seen in practice — because it usually leads to rapid demise of the patient. In addition to its uncommon occurrence — another clue that the ECG in Figure-1 does not represent LMain occlusion is that ST elevation is clearly more marked in lead V1 than in lead aVR. In contrast, with LMain disease or occlusion — ST elevation is generally more marked in aVR compared to V1.
  • This patient is an ideal candidate for acute reperfusion — because there is marked ST elevation in Figure-1, but no anterior Q waves have yet formed. The cath lab should be immediately activated.
Two follow-up ECGs to Figure‑1 are shown below. For clarity — We use a different color border for each tracing:
  • Figure-1ECG #1 (blue border) = the initial ECG obtained at presentation.
  • Figure-2ECG #2 (red border) = obtained a short while after ECG #1.
  • Figure-3ECG #3 (green border) = obtained after acute cath and angioplasty/stenting of the acutely occluded LAD.
As you evaluate these serial ECGs — Keep in mind the following Questions:
  • Is there ECG evidence of evolution on these serial ECGs?
  • Was acute reperfusion successful (Figure-3)?

Figure-2: This is ECG #2 (red border) — obtained a short while after ECG #1 from this patient with acute STEMI. Note that since ECG #1 — there has been interim development of RBBB (an rSr’ complex is now seen in V1 with wide terminal S waves in leads I,V6). The appearance of lead V2 is concerning — as the large new Q wave and now T wave inversion in this lead suggest ongoing evolution is in progress. 

------------------------------------------
Figure-3: This is ECG #3 (green border) — obtained after acute catheterization and angioplasty/stenting of the acutely occluded LAD. The “good news” — is that this post-cath ECG #3 is encouraging! Note that the QRS complex has narrowed and RBBB is no longer present. The Q wave seen earlier in lead V2 of ECG #2 has resolved — and ST-T waves have essentially returned to baseline. R wave progression is essentially normal (with transition between V3-to-V4). It appears that acute reperfusion has salvaged significant myocardium!


------------------------------------------
BOTTOM Line: Use of serial ECGs may be extremely valuable in following the course of acute MI. Lead-to-lead comparison of QRS morphology and ST‑T wave changes facilitates determining which changes are new — as well as providing insight to the likely benefit obtained from acute intervention.


------------------------------------------
The LAD: Taking A Closer Look
The normal (expected) coronary anatomy of the LCA (Left-Coronary Artery) is depicted in schematic Figure-4:
  • The LCA arises from the left aortic sinus. This vessel begins as the LMain (Left Main Coronary Artery), which is typically a short vessel (<10mm) that then bifurcates into the LAD (Left Anterior Descending Artery) and the LCx (Left Circumflex Coronary Artery).

Major Branches of the LAD: The LAD (Left-Anterior-Descending) Artery runs along the anterior epicardial surface of the heart in the interventricular groove on its path toward the cardiac apex. The LAD generally supplies the anterior wall of the heart, the cardiac apex and a major portion of the conduction system.
  • The major branches of the LAD are i) the Septal perforator vessels; and ii) Diagonal branches.
  • Septal branch anatomy is highly variable. We show 2 septal branches in Figure-4 (S-1; S-2) — but instead there may be only one septal branch or many septal branches, depending on individual anatomy. The 1st septal branch is typically the largest; its takeoff is generally just after the takeoff of the 1st diagonal branch.
  • The interventricular septum is the most densely vascularized area of the heart. This is as it should be given the integral role of the septum in providing blood supply to the heart’s conduction system. Septal perforators normally run a vertical path downward following their takeoff from the proximal LAD.
  • Downward penetrating septal branches from the LAD typically connect with upward penetrating septal branches from the PDA branch of the RCA. In this way — there is usually a network of collaterals from both LCA and RCA systems in the event of disease in one system. How adequately collaterals from one system compensate for disease in the other is subject to individual variation (as well as to how rapidly occlusive disease develops).
  • Clinical Note: Very proximal LAD lesions have been known as “widow-makers”. Especially if proximal to the 1st septal perforator (and the 1st diagonal branch) these lesions are virtual “left-main-equivalents” because of the extent of injury and conduction system damage they cause.
  • Diagonal branch anatomy is also highly variable. We show 2 diagonal branches in Figure-4 (D-1; D-2) — but there may be 1, 2, or 3 diagonal branches supplying the anterolateral wall of the heart. Occasionally — there is no diagonal branch per se, but rather a discrete ramus intermedius arising from between the LAD and LCx to supply the anterolateral surface (not shown on Figure-4). Typically — it is the 1st diagonal branch that is the largest.
  • Clinical Note: Considerable variation in number and course of diagonal branch anatomy (and the angulated path that these vessels follow) may require multiple views on cath to determine if occlusion is present.
  • NOTE-2: Additional variations in anatomy are not uncommon. One to be aware of is a “wraparound” LAD — in which the LAD is a larger and longer vessel, to the point of extending beyond the cardiac apex and “wrapping around” to supply the undersurface (= inferior wall) of the heart. Awareness of this anatomic variant provides one explanation for the ECG pattern of simultaneous ST elevation in inferior and anterior lead areas that may sometimes be seen due to acute occlusion of a single vessel.

Figure-4: Normal coronary anatomy of the left coronary artery and its major branches. The LCA (Left Coronary Artery) begins as a short LMain (Left Main Coronary Artery) branch — which then bifurcates into the LAD (Left Anterior Descending Arteryand the LCx (Left Circumflex Artery). Panel A — anterior view. Panel B — RAO (Right-Anterior Oblique) view. Abbreviations: S‑1,S‑2 (Septal Perforator branches); D‑1,D‑2 (Diagonal branches); M‑1,M‑2 (Obtuse Marginal branches from the LCx).


------------------------------------------
Acute LAD Occlusion:
ECG findings arising from acute LAD occlusion may vary depending on: i) The relative site of occlusion within the LAD (ie, proximal to septal perforators and the 1st diagonal or more distal occlusion); ii) Any prior infarctions that may have occurred; iii) Presence of any anatomic variants (such as a “wrap-around” LAD circulation); and iv) The status of the collateral circulation. For simplicity — our comments below relate to expected ECG findings assuming no prior infarctions; no alteration in collateral circulation; and no anatomic variants.
  • Acute LAD occlusion leads to acute anterior MI. This may be extensive and also involve the lateral wall.
  • The most typical ECG manifestation of acute LAD occlusion is ST elevation in anterior leads (usually in ≥2 leads between V1-to-V4).
PEARL: ST elevation in lead aVL — may provide an invaluable clue to the location of the acutely occluded coronary artery. According to a study by Birnbaum et al (Am Heart J 131:38, 1996):
  • Suspect acute LAD occlusion proximal to the 1st Diagonal IF in addition to ST elevation in aVL — there is also ST elevation in leads V2-through-V5. This is the most common situation when there is ST elevation in lead aVL.
  • Suspect 1st Diagonal branch occlusion IF in addition to ST elevation in aVL — there is ST elevation in lead V2 (but not in V3,V4,V5).
  • Suspect LCx occlusion (especially of the 1st obtuse marginal branch) — IF there is ST elevation in aVL but not in lead V2 (and not in other anterior leads).
NOTE: Anterior ST elevation without ST elevation in lead aVL — usually suggests more distal LAD occlusion after takeoff of the 1st Diagonal.
  • PEARL: In addition to recognizing ST elevation in lead aVL with marked anterior ST elevation — there are 2 additional ways to identify patients at high risk of impending proximal LAD occlusion. These are: i) Recognition of Wellens’ Syndrome (Click here for more on Wellens' Syndrome); and ii) Recognition of DeWinter T Waves (See ECG Blog #53).


------------------------------------------
RETURN to Figure-1: Is this Proximal LAD Occlusion?
Application of the above concepts to the ECG shown in Figure-1 (reproduced below in Figure-5) — supports our presumption of a proximal LAD occlusion. Although this patient “failed to read the textbook”, in that there is no ST elevation in lead aVL — proximal LAD occlusion is still strongly suggested because: i) There is marked ST elevation in all anterior leads, including significant ST elevation in lead V1; ii) ST elevation in lead V1 is clearly more than in lead aVR (virtually no ST elevation in aVR); andiii) The patient developed septal Q waves (in lead V2) as well as RBBB on the follow-up tracing (Figure-2). RBBB and the septal Q wave fortunately resolved following the good result obtained from acute reperfusion.

Figure-5: This is ECG #1 (reproduced from Figure-1) — obtained from this patient with new-onset chest pain. Despite lack of ST elevation in lead aVL — we strongly suspect proximal LAD occlusion (See text).

-------------------------------------

Link to Section 10.0 for pdf download on the ECG Diagnosis of Acute MI (from our ECG-2014-ePub).
  • ECG Changes of Acute MI — begins in Section 10.1 - 
  • Discussion of the Coronary Circulation (and determining the "culprit" artery) — begins in Section 10.16 - 
  • See ECG BLOG #80 for a case involving differentiation between acute RCA vs LCx occlusion.
------------------------------------