
The ECG in Figure-1 was obtained from a previously healthy woman in her mid-30s — who presented to the ED (Emergency Department) with palpitations. She was hemodynamically stable.
QUESTIONS:
- How would YOU interpret the ECG in Figure-1?
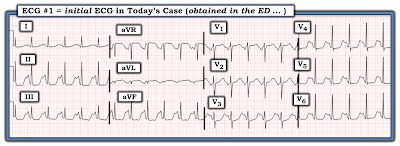 |
| Figure-1: ECG from a prevously healthy young woman with palpitations. |
My THOUGHTS on ECG #1:
As always — I approached the ECG shown in Figure-1 systematically (See ECG Blog #205 for my Systematic Approach to 12-Lead ECGs). My interpretation was as follows:
- The QRS complex is narrow — so the rhythm is supraventricular.
- The rhythm is rapid (ie, ~135-140/minute) and regular.
- P waves do appear to be present! These P waves look bizarre in lead II (and in the other inferior leads) — because of the highly unusual ST segment and T wave (See below). But the definite negative P wave deflection, with similar PR interval that is clearly seen in leads V1 and V2 confirms that sinus P waves are present! So the rhythm is a very rapid Sinus Tachycardia at ~135-140/minute.
- The PR interval for the tachycardia seen in Figure-1 appears to be normal (ie, It is common for the PR interval to shorten a bit with tachycardia).
- As already noted — the QRS complex is narrow.
- However, the 3rd interval ( = the QTc = the QT interval corrected for heart rate) — is markedly prolonged. Assessment of the QTc becomes progressively more difficult as the heart rate becomes faster (especially at rates well over 100/minute). That said, the QT interval for ECG #1 in Figure-1 takes up at least 3/4 of the R-R interval! — so that despite the fast heart rate, the QTc is obviously markedly prolonged.
- The frontal plane Axis in Figure-1 is normal (about +70 degrees).
- Chamber Enlargement – None.
==================================
PEARL #1: Even before completing our systematic assessment of the ECG in Figure-1 — I think it worthwhile to introduce the short LIST of Causes of QTc Prolongation that should routinely be considered whenever you encounter a prolonged QTc. This list becomes especially relevant given the dramatic increase in the QTc seen in ECG #1. Assuming there is no bundle branch block, ischemia or infarction (as these entities can prolong the QT) — THINK OF 3 principal Causes:
- i) DRUGS (many drugs prolong the QT interval — and combinations of drugs may result in marked prolongation).
- ii) LYTES (ie, Think of low K+ and/or low Mg++ and/or low Ca++)
- — and/or —
- iii) a CNS Catastrophe (ie, stroke, bleed, coma, seizure, trauma, brain tumor).
- NOTE: Since the patient in today's case is a previously healthy young woman who is alert enough to complain of "palpitations" — it would seem that a CNS Catastrophe is unlikely. We might also infer that this otherwise healthy young adult woman would probably not be on sufficient medication (ie, "Drugs") to cause marked QTc prolongation. Therefore, even before completing our systematic assessment — recognition of the markedly prolonged QTc should immediately prompt consideration of electrolyte disturbance (ie, "Lytes") as a very possible underlying cause.
==================================
Regarding Q-R-S-T Changes for the ECG in Figure-1:
- Q waves: There is a tiny Q wave (QS complex) in lead aVL.
- R wave progression: Normal — with transition (ie, the point where the R wave gets taller than the S wave is deep) occurring normally between leads V3-to-V4.
- ST-T wave changes: Bizarre! ST segments are surprisingly flat in multiple leads (ie, II,III,aVF; and in V4,V5,V6). As I noted earlier — despite the tachycardia, the QTc is markedly prolonged.
- NOTE: For clarity, I have labeled in Figure-2 — selected P waves (in leads II,V1,V2,V4) — and, I've added labels to distinguish between the depressed, flattened ST segments and their neighboring T (and/or U) waves in leads II and V4.
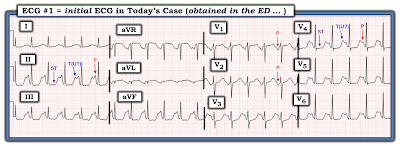 |
| Figure-2: I have labeled the intervals I describe above in the text. NOTE: My landmarks for orientation are the negative P waves in leads V1 and V2 (which I know are sinus P waves!). This P wave landmark confirms for me that the RED arrows I have placed in leads II and V4 are truly pointing to sinus P waves in those leads. I suspect the reason for the huge P wave downslope in lead II is less the "size" of this P wave — and more the fact that the T waves (and/or U waves) are so tall, and the ST segment is placed so low in this bizarre-looking ECG. |
- LAB RESULTS: The "Clinical Answer" explaining the bizarre appearance of this ECG became evident with return of initial lab results. Serum K+ was markedly decreased = 2.6 mEq/L (Serum Mg++ was similarly decreased).
 |
| Figure-3: Sequential development of ST-T wave changes of hypokalemia. Note increasing U wave amplitude (See text). |
- Not all patients read the textbook. I’ve seen many patients with all of the ECG findings shown in Figure-3 who had normal serum K+. I’ve also seen patients with mild-to-moderate hypokalemia who did not manifest any of the signs in Figure-3. Thus, in my experience — the ECG is less than optimally sensitive or specific as a tool for detecting mild-to-moderate hypokalemia. That said — with more severe degrees of Hypokalemia, the ECG tends to do much better in its prediction, and the ECG is very unlikely to be "normal".
- PEARL #2 — The finding of U-waves is not specific for hypokalemia! U waves may also be found in patients with LVH and/or bradycardia, and occasionally as a normal variant. That said — when U waves are present, and the clinical history is consistent with (or suggestive of) hypokalemia (as in a patient with vomiting, weakness, a history of alcohol abuse — or in someone taking diuretics) — prompt assessment of serum electrolytes becomes essential!
- PEARL #3 — IF U waves are so large that they become bigger than (or almost as big as) T waves — then the ECG becomes much more reliable for predicting significant hypokalemia (Panels E and F in Figure-3).
- PEARL #4 — In my experience — Hypomagnesemia produces virtually identical ECG changes as hypokalemia. This is important — because serum Mg++ levels are not necessarily included in chem profiles unless specifically ordered. Low body magnesium is often encountered in association with other electrolyte abnormalities (ie, low sodium, potassium, calcium or phosphorus); acute MI; cardiac arrest; digoxin/diuretic use; alcohol use and abuse; renal impairment.
- PEARL #5: In theory — pure hypocalcemia does not affect the T wave! As a result — the characteristic ECG picture of hypocalcemia is that of a flat and prolonged ST segment, at the end of which occurs a surprisingly normal-looking T wave.
- NOTE: This characteristic picture for hypocalcemia may of course change IF the patient also has hyper- or hypokalemia (as in today's case — in which associated hypokalemia might account for those large T/U waves at the end of the prolonged flattened ST segments).
- Unfortunately, I do not know what the serum Ca++ level was in today's case. However — the fact that the ST segments are so flat in multiple leads in ECG #1 makes me wonder IF in addition to hypokalemia and hypomagnesemia — there may also have been hypocalcemia.
==================================
- CLICK HERE — for download PDF of Section 11 (from my ECG-2014-ePub) on the ECG Diagnosis of Electrolyte Disorders.
==================================
Today's CASE Continues:
The patient in today's case was treated with electrolyte replacement. Figure-4 shows the follow-up ECG #2 — that was obtained after partial K+ replacement, at which time serum K+ = 3.5 mEq/L (compared to the initial serum K+ value = 2.6 mEq/L, at the time ECG #1 was recorded).
QUESTIONS regarding Figure-4:
- Are there still ECG findings suggestive of hypokalemia in ECG #2?
- How does ECG #2 compare with ECG #1?
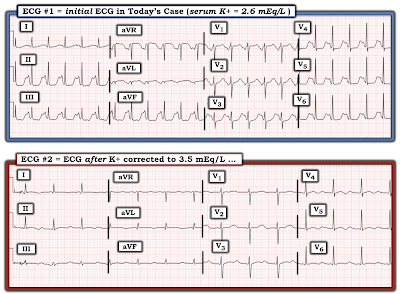 |
| Figure-4: Comparison of the initial ECG in todays case (when serum K+ = 2.6 mEq/L) — with the follow-up ECG done when serum K+ = 3.5 mEq/L. |
- Did YOU Notice that we do not clearly see an upright P wave in lead II of ECG #2? There does appear to be a small, upright P wave with a short PR interval in leads I and aVL of ECG #2 — and a small, negative P wave with short PR interval in lead III. Thus, the rhythm in ECG #2 is not sinus. Instead — there appears to be a Low Atrial Rhythm.
- Among the ECG findings of hypokalemia described in Figure-3 that persist in ECG #2 are: i) Nonspecific ST segment flattening in multiple leads; and, ii) Persistent U waves (that are most prominent in the leads that I've labeled in Figure-5).
- Note that as serum K+ increases — it becomes easier to define the limits of the U waves that I have labeled.
- Note also that the Q-U interval remains prolonged — and that U wave amplitude uniformly exceeds the height of those T waves just before them. That said — the ST segment in multiple leads is clearly not as straight and depressed as it was in ECG #1 — and the giant U waves seen in ECG #1 are considerably smaller in ECG #2.
- PEARL #6: Although serial ECGs will generally show regression of many of the ECG findings of hypokalemia as electrolyte deficiencies are corrected — there is no linear relationship between serum K+ levels and ECG appearance. There may also be a "lag" in time before corrective ECG changes are seen. That said — I viewed it as encouraging that the overall ECG changes of hypokalemia were less marked in ECG #2.
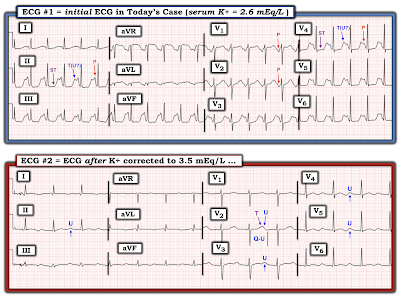 |
| Figure-5: I've labeled the comparison tracings shown in Figure-4. |
Perusal of the patients medical chart revealed a "baseline" ECG done 2 years prior to ECG #1 (See Figure-6).
QUESTION:
- Do you think the serum K+ level was normal at the time the "baseline" ECG shown in Figure-6 was obtained?
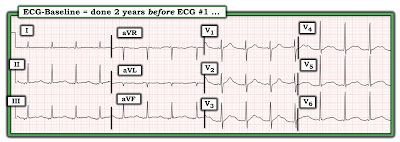 |
| Figure-6: The "baseline" ECG of today's patient, obtained 2 years before ECG #1. |
ANSWER:
One of the problems that I've encountered when "baseline" ECGs are found — is failure to seek out information regarding the patient's clinical condition at the time that the "baseline" tracing was done.
- IF a patient's "baseline" ECG was obtained at a time when they were acutely ill — then comparison of this previous ECG with the patient's current ECG will not necessarily tell us if ECG changes are new (because the patient could have been having a recurrence of his/her cardiac problem at the time that prior tracing was recorded).
- I suspect that the previous ECG shown in Figure-6 was not truly a "baseline" tracing — because a number of ECG findings highly suggestive of hypokalemia were present at that time. These include (as shown in Figure-7): i) Non-specific ST-T wave flattening in each of the limb leads; and, ii) Prominent U waves in the leads I have labeled (with U wave amplitude exceeding T wave amplitude in leads V4 and V5).
- PEARL #7 — I have found it insightful (when possible) to follow patients who have severe electrolyte disorders, with serial ECGs. Doing so allows you to follow the evolution of ST-T wave and U wave changes as serum electrolytes are corrected. As is the case for hyperkalemia — You have NO idea as to what this patient's true "baseline" ECG looks like until you repeat the ECG after you have corrected serum electrolytes.
- PEARL #8: In my experience — The ECG picture of hypokalemia comes in many forms. Most of the time — these different forms end up being some variation of the U wave.
- P.S. — Once again, the rhythm in Figure-7 is not sinus, because there is no clearly upright P wave in lead II. Instead — the small amplitude P wave with short PR interval in lead I — together with slight negativity of the P wave in each of the inferior leads once again suggests a low atrial rhythm.
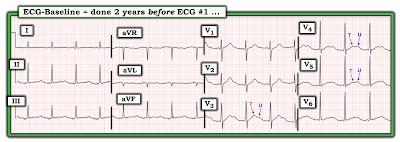 |
| Figure-7: I've labeled the "baseline" ECG shown in Figure-6. |
- See ECG Blog #205 — Reviews my Systematic Approach to 12-lead ECG Interpretation.
- ECG Blog #152 — for Review through a case on Assessment of the QTc Interval.
- ECG Blog #27 — for a Review of a case with Hypokalemia.
- The May 9, 2020 post in Dr. Smith's ECG Blog (Please see My Comment at the bottom of the page) — for Review on the "Many Faces" of Hypokalemia.
- The March 19, 2019 post in Dr. Smith's ECG Blog (Please see My Comment at the bottom of the page) — for Review of a handy method to rapidly Estimate the QTc and for discussion of a case with a prolonged QTc due to Hypocalcemia.
- The May 3, 2020 post in Dr. Smith's ECG Blog (Please see My Comment at the bottom of the page) — for Review of a case with a long QTc and profound ST-T wave abnormalities due to Hypokalemia.
Very nice case and thorough explanation
ReplyDeleteTHANK YOU! Glad it was helpful — :)
Delete