
- Question #1: Is there AV Dissociation in Figure-1?
- Question #2: Do YOU agree that the rhythm shown in this figure represents complete ( = 3rd-degree) AV Block?
- Extra Credit: Why do I suspect that a majority of those reading this post will get the answer to Question #2 wrong?
 |
| Figure-1: This 2-lead rhythm strip was obtained from an elderly woman with syncope. Do YOU agree that this rhythm represents complete AV block? (See text). |
What were YOUR Answers?
- Your Answer to Question #1 —
- Your Answer to Question #2 —
=======================================
NOTE: Some readers may prefer at this point to watch today's ECG Media Pearl #8 before moving on to my final interpretation. That said — Feel free at any time to review my My Thoughts on ECG #1 (that appear just below ECG MP-8).
=======================================
Today’s ECG Media PEARL #8 (7:00 minutes Video) — is an ECG video that reviews the difference between AV Dissociation vs Complete AV Block — and illustrates this difference while explaining the interpretation of the rhythm in Figure-1.
- NOTE: See also ECG Blog #192 — which emphasizes the 3 Causes of AV Dissociation.
=======================================
MY Thoughts on the Rhythm in Figure-1:
Note that the above ECG Media PEARL #8 reviews interpretation of the rhythm in Figure-1 in detail. For clarity — I reproduce below selected KEY figures from this video.
- We see a total of only 5 beats in Figure-1. The ventricular rhythm is regular at a rate just under 50/minute. It is difficult to assess QRS duration from just these 2 leads — but it looks like there may be slight QRS widening (at the least, we see a multiphasic QRS complex in lead V1).
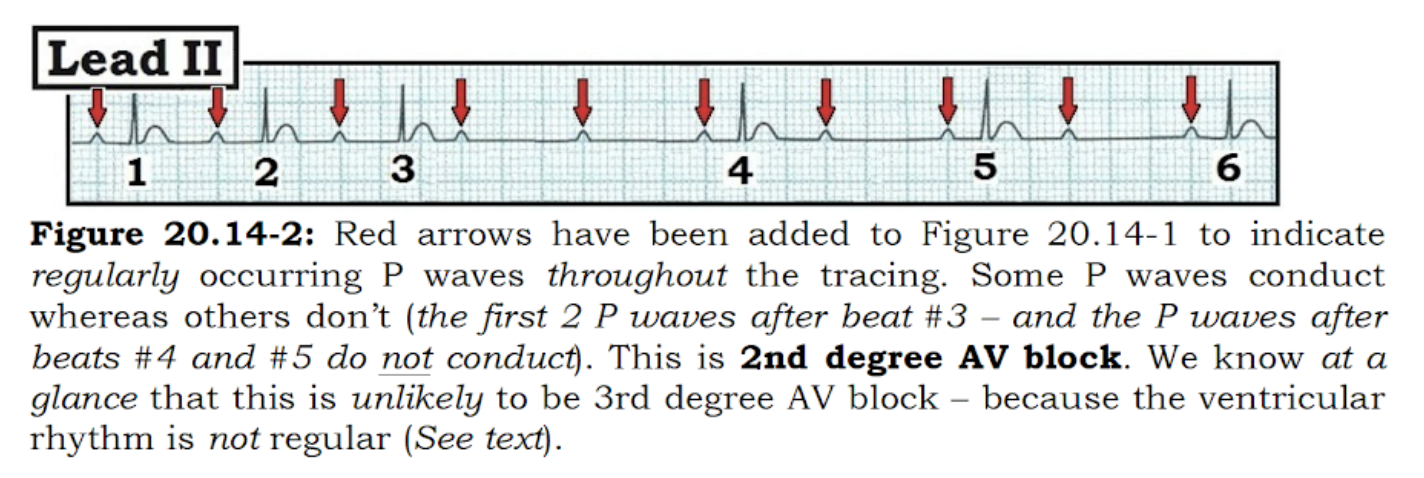
- The atrial rhythm is fairly regular at a rate of ~100-110/minute (RED arrows highlighting P waves that we are certain about). Use of calipers tells us to expect another P wave at the spot highlighted by the PINK arrow (Figure-2). So, given the overall regular appearance of the 10 other P waves in this tracing (RED arrows) — we can be almost certain that P wave regularity continues, even though 1 P wave is hidden by simultaneous occurrence of the QRS complex of beat #3.
 |
| Figure-2: I’ve added RED arrows to Figure-1 to indicate P waves were are certain about. Given the overall regularity of the P wave rhythm — we strongly suspect another P wave is hiding within the QRS complex of beat #3 (PINK arrow). |
MY Thoughts on the Rhythm (Continued):
By the systematic Ps, Qs & 3R Approach to rhythm interpretation (which we discussed in detail in ECG Blog #185) — the remaining parameter not yet assessed in Figure-2 is the 3rd “R” = Are P waves Related (ie, “married” ) to neighboring QRS complexes?
- The easiest way to assess if P waves are related to neighboring QRS complexes — is to look in front of each QRS complex — and see if the PR interval stays the same or constantly changes.
- In Figure-2 — it should be readily apparent that the PR interval in front of each of the 5 QRS complexes is never the same.
- PEARL #1: To emphasize — that although the PR intervals that precede beat #1 and beat #2 look similar — use of calipers immediately shows that the PR interval preceding beat #2 is longer. Calipers also immediately show that the PR interval preceding beat #3 is longer than the PR interval preceding beat #2. Thus, the PR intervals in Figure-2 are constantly changing.
Putting This Together: In Figure-2 — there is a slightly widened QRS complex with a regular ventricular rhythm (at just under 50/minute) — a fairly regular atrial rhythm (at ~100-110/minute) — and — a PR interval before each of the 5 QRS complexes that constantly changes!
- Therefore — there is complete AV Dissociation for the 5-beat (6.4-second duration) rhythm strip shown in Figure-2 — because none of the P waves are being conducted to the ventricles.
- PEARL #2: Although there is complete AV dissociation for this 5-beat rhythm strip in Figure-2 — we have not proved that there is complete AV block. Often ignored by many clinicians is the all-important criterion for complete AV block that requires the rhythm strip to be long enough — and — the rhythm to be slow enough for P waves to occur in all phases of the cardiac cycle, yet still fail to conduct. That is, before you can prove the presence of complete AV block — you have to demonstrate that P waves have adequate opportunity to conduct (by occurring in all parts of the R-R interval) — yet still fail to do so. The 6.4-second rhythm strip in Figure-2 is unfortunately just too short to guarantee that there has been adequate opportunity for this to occur.
- As to the interpretation of this rhythm — although we have not proved the presence of complete AV block — there at the least appears to be significant 2nd-Degree AV Block — because we would normally expect the P waves occurring near the middle of each R-R interval to conduct, yet there is no evidence of any conduction (ie, no QRS complex follows closely after any of these P waves).
The Case Continues: In Figure-3 — the next 4 beats that come after beat #5 are now shown.
- Do YOU still think complete AV block is present?
 |
| Figure-3: The rhythm from Figure-2 is continued — and the next 4 beats are shown. Is there still complete AV dissociation? |
- In Figure-3 — Is there still complete AV dissociation?
MY Thoughts on Figure-3:
A number of changes are evident in Figure-3, now that we have seen the next 4 beats in the tracing.
- Note that the QRS complex narrows and changes in morphology for the last 4 beats in Figure-3.
- Regular P waves continue throughout the entire tracing. Yet as opposed to what we saw with the shorter (5-beat) tracing in Figure-2 — the PR interval preceding beats #6, 7, 8 and 9 in Figure-3 now appears to be constant! This tells us that beats #6, 7, 8 and 9 are sinus conducted — which confirms that the rhythm in Figure-2 was not complete AV block, because when P waves finally have an opportunity to conduct, they do!
- These last 4 beats in the rhythm strip also confirm the conduction defect as a form of 2nd-Degree AV Block, in which there is 2:1 AV conduction.
PEARL #3: I emphasized in the above ECG Media Pearl #8 — the difference between complete AV block vs AV dissociation without complete AV block. The KEY for making this distinction, is to look for evidence of conduction.
- The fact that the PR interval preceding beats #6, 7, 8 and 9 remains the same tells us that these beats are sinus conducted!
- Sinus conduction is further supported by narrowing of the QRS complex (with a change in QRS morphology) for these last 4 beats in Figure-3.
- NOTE: Most of the time with complete AV block — the ventricular rhythm will be regular. This is because escape rhythms are in general regular. Although extremely subtle in Figure-3 (You will need calipers to verify this!) — the R-R interval preceding beat #6 is ever-so-slightly shorter than the R-R interval preceding each of the prior 5 beats in this tracing. Recognition in a tracing with AV dissociation that a beat occurs earlier-than-expected is an excellent clue that the reason this beat occurs slightly earlier is that it is being conducted!
PEARL #4: To clarify the difference between AV dissociation vs complete AV block — I've added an ADDENDUM to this post, in which I reproduce a 7-page excerpt from my ACLS-2013 Arrhythmias (Expanded Version) book. Among the KEY "take home" points from this excerpt are the following:
- The term, “AV dissociation” — simply means that for a certain period of time, sinus P waves are not related to neighboring QRS complexes. That is, P waves preceding the QRS are not being conducted to the ventricles.
- AV dissociation may be as short-lived as occurring for 1 or 2 beats — or, it may be persistent as occurs with complete AV block.
- AV dissociation is never a “diagnosis”. Instead — it is a condition cause by “something else”. The task for the clinician is to figure out what the cause of AV dissociation is for any given rhythm. There are 3 possible causes: i) AV block itself (either from 2nd- or 3rd -degree AV block); ii) Usurpation — in which P waves transiently do not conduct because an accelerated junctional or ventricular rhythm takes over the pacemaking function (ie, “usurps” the rhythm); and/or, iii) Default — in which a junctional or ventricular escape rhythm takes over by “default”, because the rate of the sinus pacemaker has slowed down for whatever reason.
Laddergram Illustration:
To better illustrate the mechanism of the 9-beat rhythm we see in Figure-3 — I’ve drawn a laddergram (Figure-4):
- A fairly regular atrial rhythm is seen throughout the tracing (RED arrows).
- There is complete AV dissociation for the first 5 beats in the tracing — because none of the P waves during this initial part of the rhythm are conducted to the ventricles.
- It is difficult to be certain from where in the ventricles the escape rhythm arises during these first 5 beats (ie, could be from the ventricles, or from one of the hemifascicles or bundle branches) — but the escape rhythm almost certainly arises from below the AV node.
- The P wave preceding beat #6 is conducted! Note that the PR interval preceding beats #7, 8 and 9 is the same as the PR interval preceding beat #6, because all 4 of these beats are conducted.
- There is 2nd-Degree AV Block, with 2:1 AV conduction for these last 4 beats on the tracing.
- The reason for AV dissociation in Figure-4 during the initial part of the tracing is 2nd-Degree AV Block. It is impossible to be certain from this single rhythm strip, whether this represents Mobitz I or Mobitz II 2nd-degree AV block — because we never see 2 conducted P waves in a row (so we don’t know if the PR interval would progressively increase IF given a chance to do so).
- Beyond-the-Core: We also can not tell whether or not this rhythm represents a form of “high-grade” 2nd-degree AV block — because we never see 2 P waves in a row that should conduct yet fail to do so during the early portion of this rhythm strip in which there is complete AV dissociation.
- P.S.: For those wanting review on how to read (and/or draw) laddergrams — Please CHECK OUT my ECG Blog #188.
 |
| Figure-4: Laddergram illustration of the mechanism for the 9-beat rhythm strip shown in Figure-3. |
- What follows below is a 7-page excerpt from my ACLS-2013 Arrhythmias (Expanded Version) book, in which I review the distinction between AV dissociation vs complete AV block.


=======================================
NOTE: What follows below are the schematic Figures from the Addendum that appears above. These figures facilitate brief spontaneous review of KEY concepts about the AV blocks and AV dissociation — if you ever have need to "teach" (or review) the subject in minimal time.
=======================================
 |
| Review Figure-1: What is the rhythm? |
 |
| Review Figure-2: Is there AV Block? |
 |
| Review Figure-3: Types of AV Dissociation ... |
 |
| Review Figure-4a: What "kind" of AV Block? |
 |
| Review Figure-4b: I've labeled P waves from 4a. |
=======================================
NOTE: I add below the legends to the above Review Figures.
=======================================
 |
| Review Figure-1 Legend: |
 |
| Review Figures-2,3 Legend: |
 |
| Review Figure-1 Legend: This is "high-grade" AV Block. |
Hello. Thank you for this excellent ecg tracing. I thought this ecg was AVD and not a CHB just by looking at figure 1. I believe that the P wave in beat # 5 is conducting and related to its complex because it looks normal and the PRI has a normal duration. That is why I did not think the heart block is complete. Of course, after you posted figure 2, it became clearer that the following pr intervals were conducted. Am I correct or not correct that in beat 5 the p wave is conducted? Thank you so much for your explanation and your expertise. Good day to you.
ReplyDeleteThank you so much for your excellent comment! When all we saw was 5 beats — you could not tell if beat #5 (the last beat in the short strip that I initially showed) — but you just could NOT tell if those 5 beats represented simple AV dissociation with less than complete AV block or AV block. Remember that “AV dissociation” is NOT a “diagnosis”, but rather a condition that could be due to: i) AV block or ii) AV dissociation from “default” (sometimes without any AV block) or iii) “usurpation”.
DeleteOnce I show you the complete 9 beats — we see that beats #6-thru-9 definitely DO conduct. Although the PR interval before beat #5 looks “potentially normal” — it is the SHAPE of the QRS that tells me that like the 4 beats before it — beat #5 is NOT conducted. And, IF you look closely — the P wave of beat #6 begins right ON the heavy grid line — and the QRS begins just a tiny bit before the next heavy line. In contrast — the P wave of beat #5 clearly begins BEFORE the heavy grid line — and the QRS begins EARLIER with respect to the next heavy grid line compared to beat #6 — so the PR interval IS shorter before beat #5 — which confirms that beat #5 is NOT being conducted!
THANKS again for your interest! — :)