
The ECG shown in Figure-1 is from a 48-year old man who presented with acute dyspnea.
- How would YOU interpret this tracing?
- Has there been an MI? (Are Sgarbossa criteria met?).
- Is there LVH? (Can you tell with the wide QRS?).
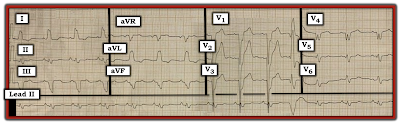 |
| Figure-1: 12-lead ECG and long lead II rhythm strip from a 48-year old man with dyspnea. |
=======================================
NOTE #1: Some readers may prefer at this point to watch the 13-minute ECG Video PEARL before reading My Thoughts regarding the ECG in Figure-1. Feel free at any time to review to My Thoughts on this tracing (that appear below ECG MP-22).
=======================================

Today's ECG Media Pearl #22 (13:15 minutes Video) — Reviews a user-friendly approach that allows diagnosis of the Bundle Branch Blocks in less than 5 seconds.
=======================================
- CLICK HERE — for FREE download PDF of this 26-page file on BBB (from my ECG-2014-ePub) — with review on the Basics for ECG diagnosis of the Bundle Branch Blocks (including diagnosis of acute MI & LVH with BBB).
=======================================
My Thoughts on the ECG in Figure-1:
As always — I favor beginning assessment by looking first at the cardiac rhythm. For clarity — I’ve numbered the beats and labeled P waves in the long lead II rhythm strip (Figure-2):
- The overall rhythm in Figure-2 is fairly (albeit not completely) regular — with upright P waves having a constant (and normal) PR interval in this lead II rhythm strip (RED arrows). Therefore — the underlying rhythm is sinus at a rate of ~85/minute.
- Beat #11 is wide, of a very different morphology, and occurs early. This beat is not preceded by any P wave. Beat #11 is a PVC (Premature Ventricular Contraction).
PEARL #1: Did YOU notice that there is no P wave before beat #12?
- Since QRS morphology of beat #12 is identical to the QRS morphology of other sinus beats in this long lead II rhythm strip — this defines beat #12 as a junctional beat. Normal sinus rhythm then resumes with beat #13.
- NOTE: I fully acknowledge that the fact that beat #12 is a junctional (and not a sinus) beat — does not impact at all on the management of this patient. My point is simply to emphasize that the BEST way not to overlook subtle abnormalities in the cardiac rhythm is to routinely spend the first 3-to-5 seconds of your assessment carefully surveying each beat in the long lead rhythm strip. All it takes is a 3-to-5 second look — going beat-to-beat in the long lead II rhythm strip, assessing atrial activity. In my experience — providers who fail to do this commonly miss abnormal findings in the rhythm that sometimes do make a definite difference in the management process.
 |
| Figure-2: I've numbered the beats and labeled P waves from Figure-1. |
Continuing with My Systematic Approach:
After assessment of Rate and Rhythm — I favor looking next at Intervals:
- As already noted — the PR interval is constant in front of the sinus beats, and normal in duration (I measure ~0.16 second).
- The QRS complex is wide (ie, clearly more than half a large box in duration). Interval duration is determined by selecting that lead in which the onset and offset of the interval can be clearly seen — and in which the interval is largest. I measure QRS duration to be ~3.5 little boxes in several of the chest leads = at least 0.14 second.
PEARL #2: There are many different "systems" for the interpretation of a 12-lead ECG. That said — Regardless of which system you prefer (be it mine or any other) — it is essential to look at Intervals at an early point in the process! The reason for this — is that criteria for Axis, Chamber Enlargement and Ischemia/Infarction all change when the QRS complex is widened by BBB (Bundle Branch Block) or IVCD (IntraVentricular Conduction Defect).
- First establish that your patient is hemodynamically stable, and not in VT (Ventricular Tachycardia). After doing so — IF the rhythm is supraventricular, but the QRS complex is wide (as it is in Figure-2) — then STOP! Before going further — Determine WHY the QRS complex is wide!
- In today's ECG Video Pearl (ECG-MP-22 — above) — I review my user-friendly approach for determining the reason for the conduction defect, be this RBBB (Right Bundle Branch Block) — LBBB (Left Bundle Branch Block) — or IVCD. With a little practice — You can determine if the conduction defect is RBBB, LBBB or IVCD in less than 5 seconds!
- NOTE: In addition to today's 13-minute ECG Video — this user-friendly approach to the BBBs is reviewed in this PDF File download (excerpted from my ECG-2014-ePub).
TAKE ANOTHER LOOK at the 12-lead ECG in today's case (Figure-3):
- We have already established that the underlying rhythm is sinus with a PVC and a junctional beat after the PVC — followed by resumption of sinus rhythm.
- WHY is the QRS complex wide in Figure-3?
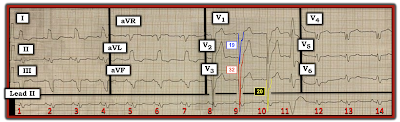 |
| Figure-3: The 12-lead ECG and rhythm strip in today's case. What do the colored QRS complexes in leads V1, V2 and V3 tell us? |
ANSWER:
The reason the QRS complex is wide in Figure-3 is that there is LBBB.
- There is a monophasic R wave in left-sided leads I and aVL.
- With typical LBBB — a similar all-upright R wave will usually also be seen in left-sided lead V6 — unless there is significant LVH (Left Ventricular Hypertrophy). As the left ventricle enlarges — the vector of left ventricular activity moves not only to the left, but also posteriorly. As a result — a monophasic R wave will sometimes not be seen with LBBB until more posteriorly-placed leads (such as V7, V8 or V9) are looked at. This is the case in today's tracing.
- The other ECG criterion for LBBB (which is also satisfied in Figure-3) — is the presence of either all negative or almost all negative QRS complexes in the anterior leads.
PEARL #3: Almost all patients with LBBB have underlying heart disease. In such patients, if there is longerm hypertension, cardiomyopathy or heart failure and LBBB — the prevalence of LVH is at least 80% even before one looks at the ECG.
- The probability that a patient with LBBB has LVH goes up to >90% — IF with LBBB there are very deep S waves (≥25-30 mm) in V1, V2 or V3. This is precisely what we see in today's tracing — in which the S waves in leads V1, V2 and V3 measure 19, 32 and 20 mm respectively (BLUE, RED and YELLOW-colored complexes in Figure-3).
QUESTION:
- Has there been an MI? (Are Sgarbossa criteria met?).
ANSWER:
As emphasized above in today's ECG Video Pearl (ECG-MP-22), and in the accompanying PDF File download — the diagnosis of ischemia/infarction is always more challenging when there is underlying BBB.
- For example — the ST-T wave depression seen in high-lateral leads I and aVL is to be expected with LBBB.
- There is no primary ST elevation in today's tracing (as was seen for example, in ECG Blog #146 — and in Blog #162).
PEARL #4: In the absence of obvious acute ST-T wave changes in a patient with LBBB — use of Smith-Modified Sgarbossa Criteria may help to determine IF there is excessive discordance sufficient for diagnosis of probable acute coronary occlusion.
- IF the J-point of the ST segment is up or down by ≥25% of QRS amplitude — then the criterion of excessive discordance is satisfied.
- CAVEAT — It may be difficult to know where the J-point is, if anterior ST elevation with LBBB is of smooth contour (in which case you won't be able to use this criterion).
- I've labeled today's tracing in Figure-4 — to illustrate application of Smith-Modified Sgarbossa Criteria. ST elevation is minimal in leads V1 and V3 of Figure-4. However, ST elevation is considerable in lead V2. The BLUE arrow in this figure indicates the change in slope that I take as the J-point in lead V2. The amount of J-point ST elevation is therefore 5 mm. Although lead overlap makes assessment of S wave depth difficult — the RED outline of the QRS complex in lead V2 shows the S wave to measure 32 mm.
- BOTTOM LINE: Although the amount of J-point ST elevation in lead V2 is considerable (ie, 5 mm) — because of marked LVH, the extremely deep S wave in this lead (of 32 mm) gives us a ratio of 5/32 — which is clearly less than 25%, such that Smith-Sgarbossa Criteria are not satisfied.
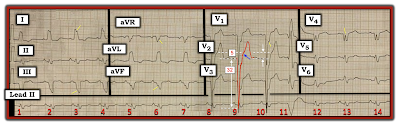 |
| Figure-4 Application of Smith-Modified Sgarbossa Criteria. |
PEARL #5: As discussed a number of times on this blog — the ECG finding of "Fragmentation" can be insightful (See ECG Blog #165). By "fragmentation" — I mean unexpected irregularities in QRS morphology, such as notching or slurring of waveforms (as highlighted by the short, slanted YELLOW lines in no less than 6 of the leads in Figure-4).
- Fragmentation suggests scarring — that may be the result of prior infarction, cardiomyopathy, or some other form of structural heart disease.
- Such fragmentation does not tell us whether heart disease is acute or has been present long-term — but it nonetheless is an invaluable clue for conveying that the patient in question almost certainly has some form of underlying structural heart disease.
Finally — the Q waves in leads V4 and V5 of Figure-4 are bizarre and unexpected. This clearly is not the usual appearance of typical LBBB — in which predominant negativity in the form of either QS or rS complexes without triphasic component are usually seen in chest leads until transition to predominant positivity occurs in the lateral chest leads.
CONCLUSION: The ECG in today's case shows sinus rhythm with a PVC. There is complete LBBB with marked LVH.
- This patient almost certainly has severe underlying heart disease — as suggested by the combination of LBBB, marked LVH + fragmentation in multiple leads + bizarre triphasic QRS complexes in leads V4 and V5, that in the context of LBBB most probably represent Q-wave equivalents. The odds are high that there have been one or more prior infarctions.
- Although nonspecific ST-T wave abnormalities are present in multiple leads — these most probably are the result of the conduction defect, LV "strain" and underlying coronary disease. While we can not rule out the possibility of some troponin rise — there is no definitive ECG evidence on this single tracing of acute coronary occlusion. Smith-Modified Sgarbossa Criteria are negative.
===============================
P.S. = ADDENDUM (3/9/2024):
Some 2 years after I initially posted this case in ECG Blog #282 — I have had occasion today to review what I wrote at that time. Looking at this case today — I would amend what I said in 2022 with the following:
- The 48-year old man presented in Blog #282 had "acute dyspnea". Additional details from the history were not provided to me. I see no indication that a repeat ECG was done. In a patient with acute symptoms (ie, shortness of breath in this case) — until such time that you can confidently either rule in or rule out an acute event — one or more repeat ECGs should be obtained. This is because development of "dynamic" ECG changes in a patient with acute symptoms could be strong evidence in support that an acute event may indeed be evolving.
- In an acute event — evolutionary ST-T wave changes sometimes develop quickly (ie, sometimes within minutes!). As a result — that 1st repeat tracing should be obtained within ~15-20 minutes, to see if there has been ST-T wave changes during that time. This apparently was not done in this case.
- Comparison with a prior (baseline) ECG on the patient may have been insightful. This also apparently was not done.
-
- Although primary ST elevation and Smith-Modified Sgarbossa Criteria are negative in today's case — ST-T wave appearance in leads V4,V5,V6 is not what one normally expects in association with LBBB because: i) In addition to the marked QRS fragmentation in lead V4 of Figure-1 — there is uncharacteristic ST segment straightening in this lead; and, ii) There is shelf-like ST segment straightening with slight depression in leads V5,V6.
- To EMPHASIZE: While the above cited ST-T wave findings in leads V4,V5,V6 of Figure-1 are not diagnostic — they are not "normal" findings with LBBB. As a result — additional measures would be warranted to attain more certainty as to whether or not these ST-T wave findings that I am retrospectively noting, might have been indication of an acute event (ie, Several repeat ECGs looking for "dynamic" changes should have been done — search for a prior ECG on this patient to compare with this initial ECG — and serial troponins).
- I wish I had more follow-up on this case ...
=======================
Acknowledgment: My appreciation to Abdullah Al Mamum (from Dhaka, Bangladesh) for the case and this tracing.
=======================
=============================
Relevant LINKS to Today's Case:
=============================
Relevant ECG Blog Posts to Today’s Post:
- See ECG Blog #185 — for review of the Systematic Ps, Qs, 3R Approach to Rhythm Interpretation.
- ECG Blog #205 — Reviews my Systematic Approach to 12-lead ECG Interpretation.
- ECG Blog #93 — Reviews at a more basic level my approach to Systematic ECG Interpretation.
- ECG Blog #198 — An Irregular WCT (LBBB or IVCD).
- ECG Blog #162 — LBBB with obvious STEMI.
- ECG Blog #146 — LBBB with Acute ST-T Wave Changes.
- ECG Blog #204 — Assessment of Sinus Rhythm and a Wide QRS (due to IVCD).
- ECG Blog #165 — How to "Date" an Infarction — Assessment for possible LV Aneurysm — and — the diagnostic value of recognizing "Fragmentation".
- ECG Blog #145 — RBBB with Diffuse Subendocardial Ischemia.
- ECG Blog #144 — AV Block and Alternating BBB.
- ECG Blog #140 — Atrial Bigeminy with Alternating RBBB/LAHB-LPHB Aberration.
- ECG Blog #135 — Regular WCT that Looks like Fascicular VT (but is Not!).
- ECG Blog #130 — 2nd-Degree with Alternating BBB (LBBB-RBBB).
- ECG Blog #122 — Bifascicular Block in a Child with Congenital Heart Disease.
- The January 31, 2022 post in Dr. Smith's ECG Blog — Reviews subtle signs of acute OMI in a patient with LBBB (Please see My Comment at the bottom of the page).
- The June 25, 2020 post in Dr. Smith’s ECG Blog — in which I review a case of Sinus Rhythm with Intermittent RBBB.
No comments:
Post a Comment