Saturday, December 30, 2023

ECG Blog #410 — How Tall are the T Waves?


QUESTION:
  • HOW would YOU interpret the ECG in Figure-1 — if no clinical information was provided? 

Figure-1: The initial ECG in today's case. (To improve visualization — I've digitized the original ECG using PMcardio).


==================================
The HISTORY in Today's CASE:
The patient in today's case is a teenager who presented to the ED (Emergency Department) in cardiac arrest after electrocution. The ECG in Figure-1 — was obtained following successful resuscitation.
  • The "good news" — is that after an extended hospitalization, the patient was finally discharged home, and doing well.

==================================

A Closer Look at Today's ECG:
The rhythm in Figure-1 is sinus — with regular upright P waves with a constant and normal PR interval in lead II.
  • At 1st glance of the chest leads — the QRS complex appears to be significantly widened. However, on looking closer at leads V1 and V6 — and especially at the QRS in the limb leads — it becomes apparent that the QRS is probably of normal duration!
  • But — IF the QRS is not prolonged — this means that we are looking at perhaps the greatest amount of ST segment elevation in lead V3 that I (and perhaps you) have ever seen! (that attains more than 40 mm in lead V4).

  • As discussed in ECG Blog #364 and ECG Blog #265 — We are looking at "Shark Fin" ST elevation!


Shark Fin Morphology
It's important to be aware of the pattern of "Shark Fin" ST segment elevation — in which the QRS complex looks wide, because it blends in with ST segments that show extreme ST elevation in multiple leads. As a result — the boundary between the end of the QRS complex and the beginning of the ST segment becomes indistinguishable in those leads showing marked ST elevation or depression.
  • "Shark Fin" ST segment elevation is most often a sign of severe transmural ischemia that results from acute coronary occlusion. Today's case is different in that profound myocardial injury (from electrocution) rather than acute coronary occlusion is the cause of this ECG pattern.

  • PEARL: The KEY for confirming that "Shark Fin" morphology is the cause of the striking ECG picture in Figure-1 — is to find 1 or 2 leads in which you can clearly define the limits (end point) of the QRS complex. The most helpful leads for clarifying the end point of the QRS in today's case are lead V1 and lead V6
  • Note in Figure-2 — that I've drawn in a RED line parallel to the heavy ECG grid line in the simultaneously-recorded chest leads. By choosing the end point of the QRS that is clearly visible in leads V1 and V6 — I'm able to define the end point of the QRS complex in the other chest leads ( = leads V2-thru-V5), knowing that the ST segment begins just to the right of this vertical RED line.

Figure-2: I've drawn a vertical timeline downward from the end point of the QRS complex in lead V1 — so as to define the beginning of the ST segment in the other chest leads. Note that this vertical RED line passes through the clearly defined end point of the QRS complex in lead V6 (See text).


BOTTOM Line in Today's CASE:
Since the vertical RED line in Figure-2 marks the end of the QRS complex in each of the 6 chest leads — everything to the right of this RED line represents the markedly elevated "shark fin" shape of ST elevation.
  • Alternatively — the shape of the ST elevation in lead V2 might also be consistent with a component of Brugada Phenocopy (See ECG Blog #238). That said, even if true — ST elevation in the remaining chest leads is still virtually certain to represent "shark fin" ST elevation from severe myocardial injury.


==========================================

Acknowledgment: My appreciation to Hamdallah Naser (from AL-Najaf, Iraq) for the case and this tracing.

==========================================


=====================================


ADDENDUM (12/30/2023):
  • The Audio Pearl below reviews the concept of "shark fin" ST elevation. 

ECG Media PEARL #73 (5:40 minutes Audio) — Reviews the concept of "Shark Fin" Selevation and depression as a sign of extensive acute infarction.


==============================

Additional Relevant ECG Blog Posts to Today’s Case:


Saturday, December 23, 2023

ECG Blog #409 — Every-Other-Beat ...

 
The ECG in Figure-1 —  was obtained from a patient with palpitations. The patient was hemodynamically stable in association with this rhythm.

QUESTIONS:
  • What is the rhythm in Figure-1
  •   — How certain are you of your answer? 

  •      —  Why is QRS morphology changing

Figure-1: The initial ECG in today's case.


My Interpretation of the ECG in Figure-1:
Since the patient is hemodynamically stable — there is time for systematic assessment of the rhythm. By the Ps, Qs, 3R Approach (See ECG Blog #185):
  • The rhythm is fast and QRS complexes are Regular. Since the R-R interval is just under 2 large boxes in duration — I estimate the ventricular Rate to be just over 150/minute.

  • QRS morphology varies every-other-beat! This is perhaps best seen in lead V1 (but also well seen in leads V3,V4,V6). The QRS is narrow in odd-numbered beats (but the QRS is wide in even-numbered beats).

  • Sinus P waves appear to be absent — because we do not see a clearly defined upright P wave in lead II. Instead — a negative deflection appears to precede each QRS complex in lead II (and we can see this negative deflection in front of each of the 26 beats in the long lead II rhythm strip).

  • PEARL #1: Although we know these negative deflections in front of the QRS are not sinus P waves (because, as noted above — these deflections are not upright in lead II) — there does appear to be a fixed interval (distance) between these negative deflections and the QRS complex that follows. This suggests these negative deflections represent some other form of atrial activity (that by the 5th parameter in the Ps,Qs,3R Approach) — is Related to neighboring QRS complexes.

Putting It All Together:
By the Ps, Qs, 3R Approach — We have determined that the rhythm in Figure-1 manifests regular QRS complexes at a rate just over 150/minute — with some form of atrial activity that is related to neighboring QRS complexes.
  • But WHY is QRS morphology changing every-other-beat? (ie, being narrow for one beat — and then becoming wide for the next beat)?
  •   —  Is the rhythm in Figure-1 supraventricular?
  •      — What kind of atrial activity is likely to be present? 

PEARL #2: The obvious initial consideration whenever we see wide beats — is that the etiology of such beats may be ventricular. That said (as per PEARL #1) — the fact that each of the 26 beats in the long lead II rhythm strip in Figure-1 are preceded by a negative deflection with a fixed interval between this negative deflection and the QRS complex that follows (BLUE arrows in the long lead II in Figure-2) — is against these wide beats being ventricular in etiology.
  • IF the wide beats were ventricular — we would not expect the interval from the negative deflection preceding each QRS to be equal.
  • Instead — the fact that the interval from the negative deflection preceding each of the 26 beats in the long lead II rhythm strip remains constant — suggests that each of these 26 beats are being conducted by whatever form of atrial activity these negative deflections represent.

PEARL #3: QRS morphology of the wide beats strongly supports our presumption that all 26 beats in today's initial ECG are supraventricular! (Figure-2).
  • QRS morphology of beats #14,16,18 in lead V1 is consistent with RBBB (Right Bundle Branch Block) conduction — because there is an rsR’ morphology, with S wave descending below the baseline and a taller R’ (right-“rabbit ear” deflection).
  • QRS morphology of beats #2,4,6 in lead I — and, beats #8,10,12 in lead aVL support RBBB conduction — because these lateral leads each manifest a slender, upright R wave with wide terminal S wave (RED arrows in these leads).

  • Finally (as shown in Figure-2) — Note that the wide beats in the inferior leads (especially in lead II) manifest a more marked leftward axis, consistent with LAHB (Left Anterior HemiBlock) aberration — which is yet another suggestion that all wide beats are supraventricular!

Figure-2: I've labeled the initial ECG in today's case.


PEARL #4: As emphasized in ECG Blog #204, in which I review derivation of the bundle branch blocks — RBBB is a terminal conduction delay. By this I mean that the initial vectors of ventricular depolarization occur normally when there is RBBB — and only the last part of ventricular depolarization is altered with this conduction defect.
  • As a result — the IVS (InterVentricular Septum) and the LV (Left Ventricle) depolarize normally with RBBB conduction — and it is only after the LV has depolarized that the RV (Right Ventricle) now depolarizes via slow conduction through ventricular myocardium (because of the "block" in the right bundle branch). This results in terminal depolarization moving toward the “blocked” RV — which writes a wide, terminal S wave in left-sided leads (with this S wave being wide with complete RBBB — because conduction through myocardium is slow)
  •  
  • KEY Point: Awareness that RBBB is a terminal conduction delay, with the initial vectors of ventricular depolarization being normal — may provide yet another clue that widened QRS complexes are aberrantly-conducted supraventricular beats. This concept is perhaps best illustrated for the wide beats in lead V1 of Figure-2 — in which the shape and slope of the tiny initial r-wave, followed by S wave descent in lead V1 looks identical in shape and slope to the beginning deflections of the narrow beats in this lead. 

Advanced PEARL #5 ( = Beyond-the-Core): Did YOU notice that there appears to be a technical “misadventure” in today's initial ECG — in that the QRS complex does not look as one should expect with RBBB conduction for the wide beats in lead V6? (ie, for beats #20,22,24,26 in lead V6 of Figure-2).
  • To Emphasize — that this technical mishap is an extremely subtle finding that I did not notice when I first looked at the initial ECG in today’s case. But since RBBB conduction is the result of a terminal delay in ventricular repolarization — there should be a wide, terminal S wave for wide beats #20,22,24,26 in lateral chest lead V6. Instead, there is a fragmented, all-positive QRS complex in lead V6 without any terminal S wave.

  • My Theory: I suspect that the V6 lead connection may have inadvertently been reversed with the lead connection for either V4 or V5.

===================

CONTINUED: Putting IAll Together:
Now that we’ve established that all 26 beats in today's initial ECG are supraventricular — We can deduce the following:
  • There is RBBB conduction every-other-beat in Figure-2. This is a form of rate-related BBB — in which the rapid ventricular rate may not allow sufficient time between each beat for the right bundle branch to recover.
  • Usually, rate-related BBB produces QRS widening with every beat — but on occasion, BBB conduction may only occur every-other or every-third beat.

  • This means that the rhythm in today's initial tracing — is a regular SVT (SupraVentricular Tachycardia) rhythm at ~150/minute, but without clear sign of sinus P waves. PEARL #6 below reviews the differential diagnosis:

PEARL #6: As discussed in ECG Blog #287 — Recognition that the rhythm in today's initial tracing is a regular SVT without clear sign of sinus P waves (ie, without a definite upright P wave in lead II) — should prompt consideration of the following differential diagnosis LIST:

  • i) Sinus Tachycardia (IF there is a possibility that sinus P waves might be hiding within the preceding ST-T wave)
  • ii) A Reentry SVT (either AVNRT if the reentry circuit is contained within the AV node — or AVRT if an AP [Accessory Pathway] located outside the AV node is involved)
  • iii) Atrial Tachycardia (ATach);
  • iv) Atrial Flutter (AFlutter) with 2:1 AV conduction

PEARL #7: By far (!) — the most commonly overlooked entity in the above differential diagnosis LIST is AFlutter (Atrial Flutter) — especially when the ventricular rate is close to ~150/minute (as it is in today's case)and — when there appear to be negative deflections (rather than upright P waves) in lead II.
  • The reason the ventricular rate in untreated AFlutter tends to be close to 150/minute — is that the atrial rate of flutter in patients not on antiarrhythmic medication (that might reduce the flutter rate in the atria) — tends to be very close to 300/minute in adults (ie, usual range ~250-350/minute)
  • Since the most common ventricular response to untreated AFlutter is with 2:1 AV conduction — this results in a ventricular rate HALF as fast as the flutter rate in the atria — and 300 ÷ 2 ~150/minute (usual range ~130-170/minute).

  • KEY Point: Knowing that the most commonly overlooked arrhythmia is AFlutter — suggests that the BEST way to avoid missing the diagnosis of AFlutter is simply to THINK of AFlutter whenever you have a regular SVT at a rate close to 150/minute (in which you do not clearly see upright sinus P waves in lead II).

PEARL #8: Using calipers facilitates finding the diagnostic "sawtooth" pattern of AFlutter. When looking for AFlutter — I simply set my calipers at precisely HALF the R-R interval — and then look for leads in which I can "walk out" 2:1 conduction.
  • I have done this in Figure-3 — in which slanted RED lines in the long lead II rhythm strip highlight negative dips in the baseline that occur at precisely twice the ventricular rate. This corresponds to an atrial rate of ~300/minute (P-P interval ~1 large box in duration).
  • The "sawtooth" pattern of the baseline with AFlutter is best appreciated by stepping back a little bit from the rhythm strip. The pattern is best seen in the inferior leads ( = leads II,III,aVF). The other leads that most often manifest readily identifiable 2:1 atrial activity — are leads aVR, V1 and/or V2 — so I favor first checking out these 6 leads whenever looking for AFlutter.

  • Physiologically — the most commonly observed pattern of AFlutter, known as "Typical" AFlutter — produces 2:1 negative deflections seen in the inferior leads (as seen in Figure-3) — as a result of CCW (CounterClockWise) rotation of a fixed reentrant circuit around the tricuspid valve annulus and through the cavo-tricuspid isthmus. 
  • "Atypical" AFlutter patterns may occasionally be seen, in which the rotation direction of the reentrant pathway around the tricuspid valve annulus changes to CW (ClockWise) — in which case smaller positive deflections may be seen.
  • Clinically: Initial treatment of AFlutter is the same, regardless of whether the rotation direction is CW or CCW — so this distinction is not important to the emergency provider (Cosio — Arrhythmia & EP Review 6(2):55-62, 2017). The point to remember is that IF you are able to identify regular 2:1 atrial activity at an atrial rate close to 300/minute (with a P-P interval ~1 large box in duration) — then the rhythm is almost certain to be AFlutter.

The CASE Continues:
The patient was treated with IV Amiodarone — which (as shown in Figure-3) successfully converted the AFlutter into normal sinus rhythm.
  • Although significant baseline artifact is seen in ECG #2 — regular upright sinus P waves can be seen in the long lead II rhythm strip.
  • RBBB is no longer seen after conversion to sinus rhythm — which supports our suspicion that the intermittent RBBB conduction seen every-other-beat during the tachycardia (in Figure-1) was rate-related.
  • Note that QRS morphology after conversion to sinus rhythm is very similar to QRS morphology of odd-numbered beats during the tachycardia.
  • Note also that modest T wave inversion persists after conversion to sinus rhythm (seen in leads III; and in V1-thru-V4). This most likely reflects a transient and benign "Memory" effect (ie, Not uncommonly — non-ischemic ST-T wave abnormalities may be seen for hours or even days following a sustained tachycardia).

Figure-3: Slanted RED lines in the long lead II rhythm strip of ECG #1 — highlight the "sawtooth" pattern of AFlutter.


And a Final Tracing ...
As a final advanced concept — I add one more tracing in Figure-4.
  • ECG #3 was obtained during treatment of this patient's AFlutter — at approximately the same time that ECG #1 was obtained.

  • As I noted earlier in advanced PEARL #5 — lack of a wide terminal S wave for the wide beats in lead V6 of ECG #1 did not make physiologic sense, given that beats #20,22,24,26 were conducted with RBBB aberration (within the RED rectangle in Figure-4). I suspected some type of lead connection "technical misadventure".

  • I believe ECG #3, which was obtained during the treatment process — supports my theory. Note that rather than every-other-beat RBBB conduction — rate-realted RBBB aberrancy is seen every beat in ECG #3 — and, a terminal S wave (albeit a notched deflection) is indeed seen in lead V6. As expected — wide terminal S waves are seen in the other lateral leads in ECG #3 ( = in leads I and aVL).

Figure-4: Confirmation of the "technical misadventure" I described earlier in advanced PEARL #5 (See text).


==================================
Acknowledgment: My appreciation to Chun-Hung Chen = 陳俊宏 (from Taichung City, Taiwan) for the case and this tracing.
==================================

Related ECG Blog Posts to Today’s Case:

  • ECG Blog #205 — Reviews my Systematic Approach to 12-lead ECG Interpretation.
  • ECG Blog #185 — Reviews the Ps, Qs, 3R Approach to Rhythm Interpretation.

  • See ECG Blog #240 — for Review on the ECG assessment of the patient with a regular SVT rhythm (including distinction between the various types of SVT reentry).

  • ECG Blog #287 — for a regular SVT that was AFlutter.
  • See ECG Blog #250 — for a regular SVT with ST depression.

  • ECG Blog #229 — reviews distinction between AFlutter vs ATach (and WHY AFlutter is so commonly overlooked).
  • The November 12, 2019 post in Dr. Smith's ECG Blog — in which I review my approach to a Regular SVT rhythm.

  • ECG Blog #210 — reviews the Every-Other-Beat Method for estimation of heart rate when the rhythm is very fast.

  • ECG Blog #220 — reviews my LIST #1: Causes of a regular WCT (and how to assess hemodynamic stability).

  • ECG Blog #242 — Reviews rate-related BBB.
  • ECG Blog #32 — More on rate-related BBB.

  • The August 17, 2020 post by me in Dr. Smith's ECG Blog — in which I review the phenomenon of Bradycardia-dependent BBB (sometimes called "Phase 4" or "paradoxical" block).

  • ECG Blog #211 — Reviews WHY some early beats and some SVT rhythms are conducted with Aberration (and why aberrant beats usually look like some form of conduction block).

  • ECG Blog #203 — reviews ECG recognition of the Hemiblocks.
  • ECG Blog #204 and ECG Blog #282 — reviews ECG recognition of the Bundle Branch Blocks.


ADDENDUM (12/23/2023):
I've presented this material before — but it bears repeating for reference. These concepts should be automatic for assessment of the patient who presents with a regular SVT rhythm.


ECG Media PEARL #64 (10:50 minutes Audio) — Reviews my LIST #2: Common Causes of a Regular SVT Rhythm.

===================================


ECG Media PEARL #45 (10:00 minutes Audio) — Why is Atrial FIutter so commonly overlooked? Reviews PEARLS regarding the ECG diagnosis of AFlutter — and — What's "New"? in the field, regarding distinction between AFlutter vs Atrial Tachycardia (5/29/2021).


ECG Media PEARL #57 (8:00 minutes Audio) — What is rate-related Bundle Branch Block? How does this differ from "aberrant" conduction.


Saturday, December 16, 2023

ECG Video Blog #408 (392) — 20 Minutes Later ...


======================================
 CLICK HERE — for a Video presentation of this case! (18:00 min.)

  • Below are slides used in my video presentation.
  • For full discussion of this case — See ECG Blog #392 

======================================


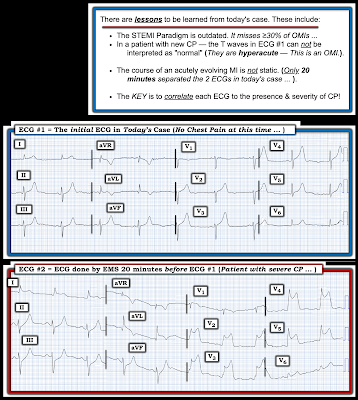
The ECG in Figure-1 was obtained from a man in his 60s — who described the sudden onset of "chest tightness" that began 20 minutes earlier, but who now (at the time this ECG was recorded) — was no longer having symptoms.
  • In view of this history — How would YOU interpret this ECG?
  • Should the cath lab be activated?  

Figure-1: The initial ECG in today's case. (To improve visualization — I've digitized the original ECG using PMcardio).


Figure-2: Comparison between the 2 ECGs recorded in today's case. ECG #2 was actually done first, at the time the EMS unit arrived on the scene (at which time the patient was having severe chest pain). About 20 minutes later (on the way to the hospital) — the patient's CP resolved, and ECG #1 was recorded.  


Related ECG Blog Posts to Today’s Case:

  • ECG Blog #205 — Reviews my Systematic Approach to 12-lead ECG Interpretation.
  • ECG Blog #185 — Reviews the Ps, Qs, 3R Approach to Rhythm Interpretation.
  • mmm
  • ECG Blog #193 — Reviews the concept of why the term “OMI” ( = Occlusion-based MI) should replace the more familiar term STEMI — and — reviews the basics on how to predict the "culpritartery.

  • ECG Blog #194 — Reviews how to tell IF the “culprit” (ie, acutely occluded) artery has reperfused using clinical and ECG data.
  • ECG Blog #294 — How to tell IF the "culprit" artery has reperfused.

  • ECG Blog #183 — Reviews the concept of deWinter T-Waves (with reproduction of the illustrative Figure from the original deWinter NEM manuscript).
  • ECG Blog #318 — ECG Blog #340 — and ECG Blog #341 — More on deWinter and deWinter-like T waves.

  • ECG Blog #218 — Reviews HOW to define a T wave as being Hyperacute?
  • ECG Blog #260 — ECG Blog #222 — and ECG Blog #292 — Reviews when a T wave is hyperacute — and the concept of "dynamicST-T wave changes.
  • ECG Blog #387 — Dynamic change in 2 minutes.

  • ECG Blog #230 — How to compare serial ECGs.

  • ECG Blog #115 — Shows an example of how drastically the ECG may change in as little as 8 minutes.

  • ECG Blog #337 — an OMI misdiagnosed as an NSTEMI ...

  • ECG Blog #184 — illustrates the "magical" mirror-image opposite relationship with acute ischemia between lead III and lead aVL (featured in Audio Pearl #2 in this blog post)
  • ECG Blog #167 — another case of the "magical" mirror-image opposite relationship between lead III and lead aVL that confirmed acute OMI.

  • ECG Blog #271 — Reviews determination of the ST segment baseline (with discussion of the entity of diffuse Subendocardial Ischemia).

  • ECG Blog #258 — How to "Date" an Infarction based on the initial ECG.

  • The importance of the new OMI (vs the old STEMI) Paradigm — See My Comment in the July 31, 2020 post in Dr. Smith's ECG Blog.
  • For review on when despite acute OMI — the initial hs-troponin may come back normal — See the March 24, 2023 post in Dr. Smith’s ECG Blog.

  • The January 9, 2019 post in Dr. Smith's ECG Blog (Please scroll down to the bottom of the page to see My Comment). This case is remarkable for the dynamic ST-T wave changes that are seen. It's helpful to appreciate: i) That acute ischemia/infarction is not the only potential cause of such changes (cardiac cath was normal); ii) That changes in heart rate, frontal plane axis and/or patient positioning can not always explain such changes; andiii) That entities such as repolariztion variants, LVH and/or acute myopericarditis may all contribute on occasion to produce an evolution of challenging dynamic ST-T wave changes on serial ECGs.

  • The August 22, 2020 post in Dr. Smith's ECG Blog — which illustrates another case of dynamic ST-T wave changes that resulted from a repolarization variant

  • The July 31, 2018 post in Dr. Smith's ECG Blog (Please scroll down to the bottom of the page to see My Comment). This case provides an excellent example of dynamic ST-T wave changes on serial tracings in a patient with an ongoing acutely evolving infarction


=======================
ADDENDUM: Some additional material on ECG diagnosis of OMI.
=======================


==================================
  • I've added several Audio Pearls below with material relevant to today's case.

Today’s ECG Media PEARL #1 (3:00 minutes Audio) — Reviews the concept of deWinter T waves (and the common occurrence of variations on this "theme" ).


ECG Media PEARL #35a (4:50 minutes Audio) — WHEN is a T Wave Hyperacute vs a Repolarization variant?

ECG Media PEARL #39a (4:50 minutes Audio) — Reviews the concept of Dynamic ST-T Wave Changes (and how this ECG finding can assist in determining if acute cardiac cath is indicated).


ECG Media PEARL #46a (6:35 minutes Audio) — Reviews HOW to compare Serial ECGs (ie, Are you comparing "Apples with Apples" — or — with Oranges?).


ECG Media PEARL #10 (10 minutes Audio) — reviews the concept of why the term “OMI” ( = Occlusion-based MIshould replace the more familiar term STEMI — and — reviews the basics on how to predict the "culprit" artery.


ECG Media PEARL #11 (6 minutes Audio) — Reviews how to tell IF the “culprit” (ie, acutely occluded) artery has reperfused, using clinical and ECG criteria